Take Flight Above the Peak
︎︎︎GartnerThis 45 minute data-focused keynote introduces solutions on how to prepare or overcome obstacles that the team/company may encounter. The solutions provided are supported by data visualizations, complex research, processes, and case studies. The incorporation of aviation and mountain visual themes in the presentation makes it feel cohesive and helps the story flow better.
To see the cool animations/transitions for each keynote, please click on the video link 🎥


Human Behaviors
︎︎︎GartnerThis 45 minute psychology-focused keynote was originally a webinar, but was elevated to a keynote due to favorable feedback. The four flames are the key components companies need to pay attention for positive outcomes. Along with the flames, the line work and animation make the presentation cohesive.
Video link 🎥
Top Technology Trends
︎︎︎GartnerA 30-minute signature presentation that introduces the top technology trends for 2026. The project was highly collaborative, fast-paced, and significant as it was presented globally at the company’s major Conference events. The 4:1 format was the presentation for the main stage, and the 16:9 format was presented to the audience in the back, other rooms, and through the company’s Conference application.
Video link to 4:1 🎥
Video link to 16:9 🎥


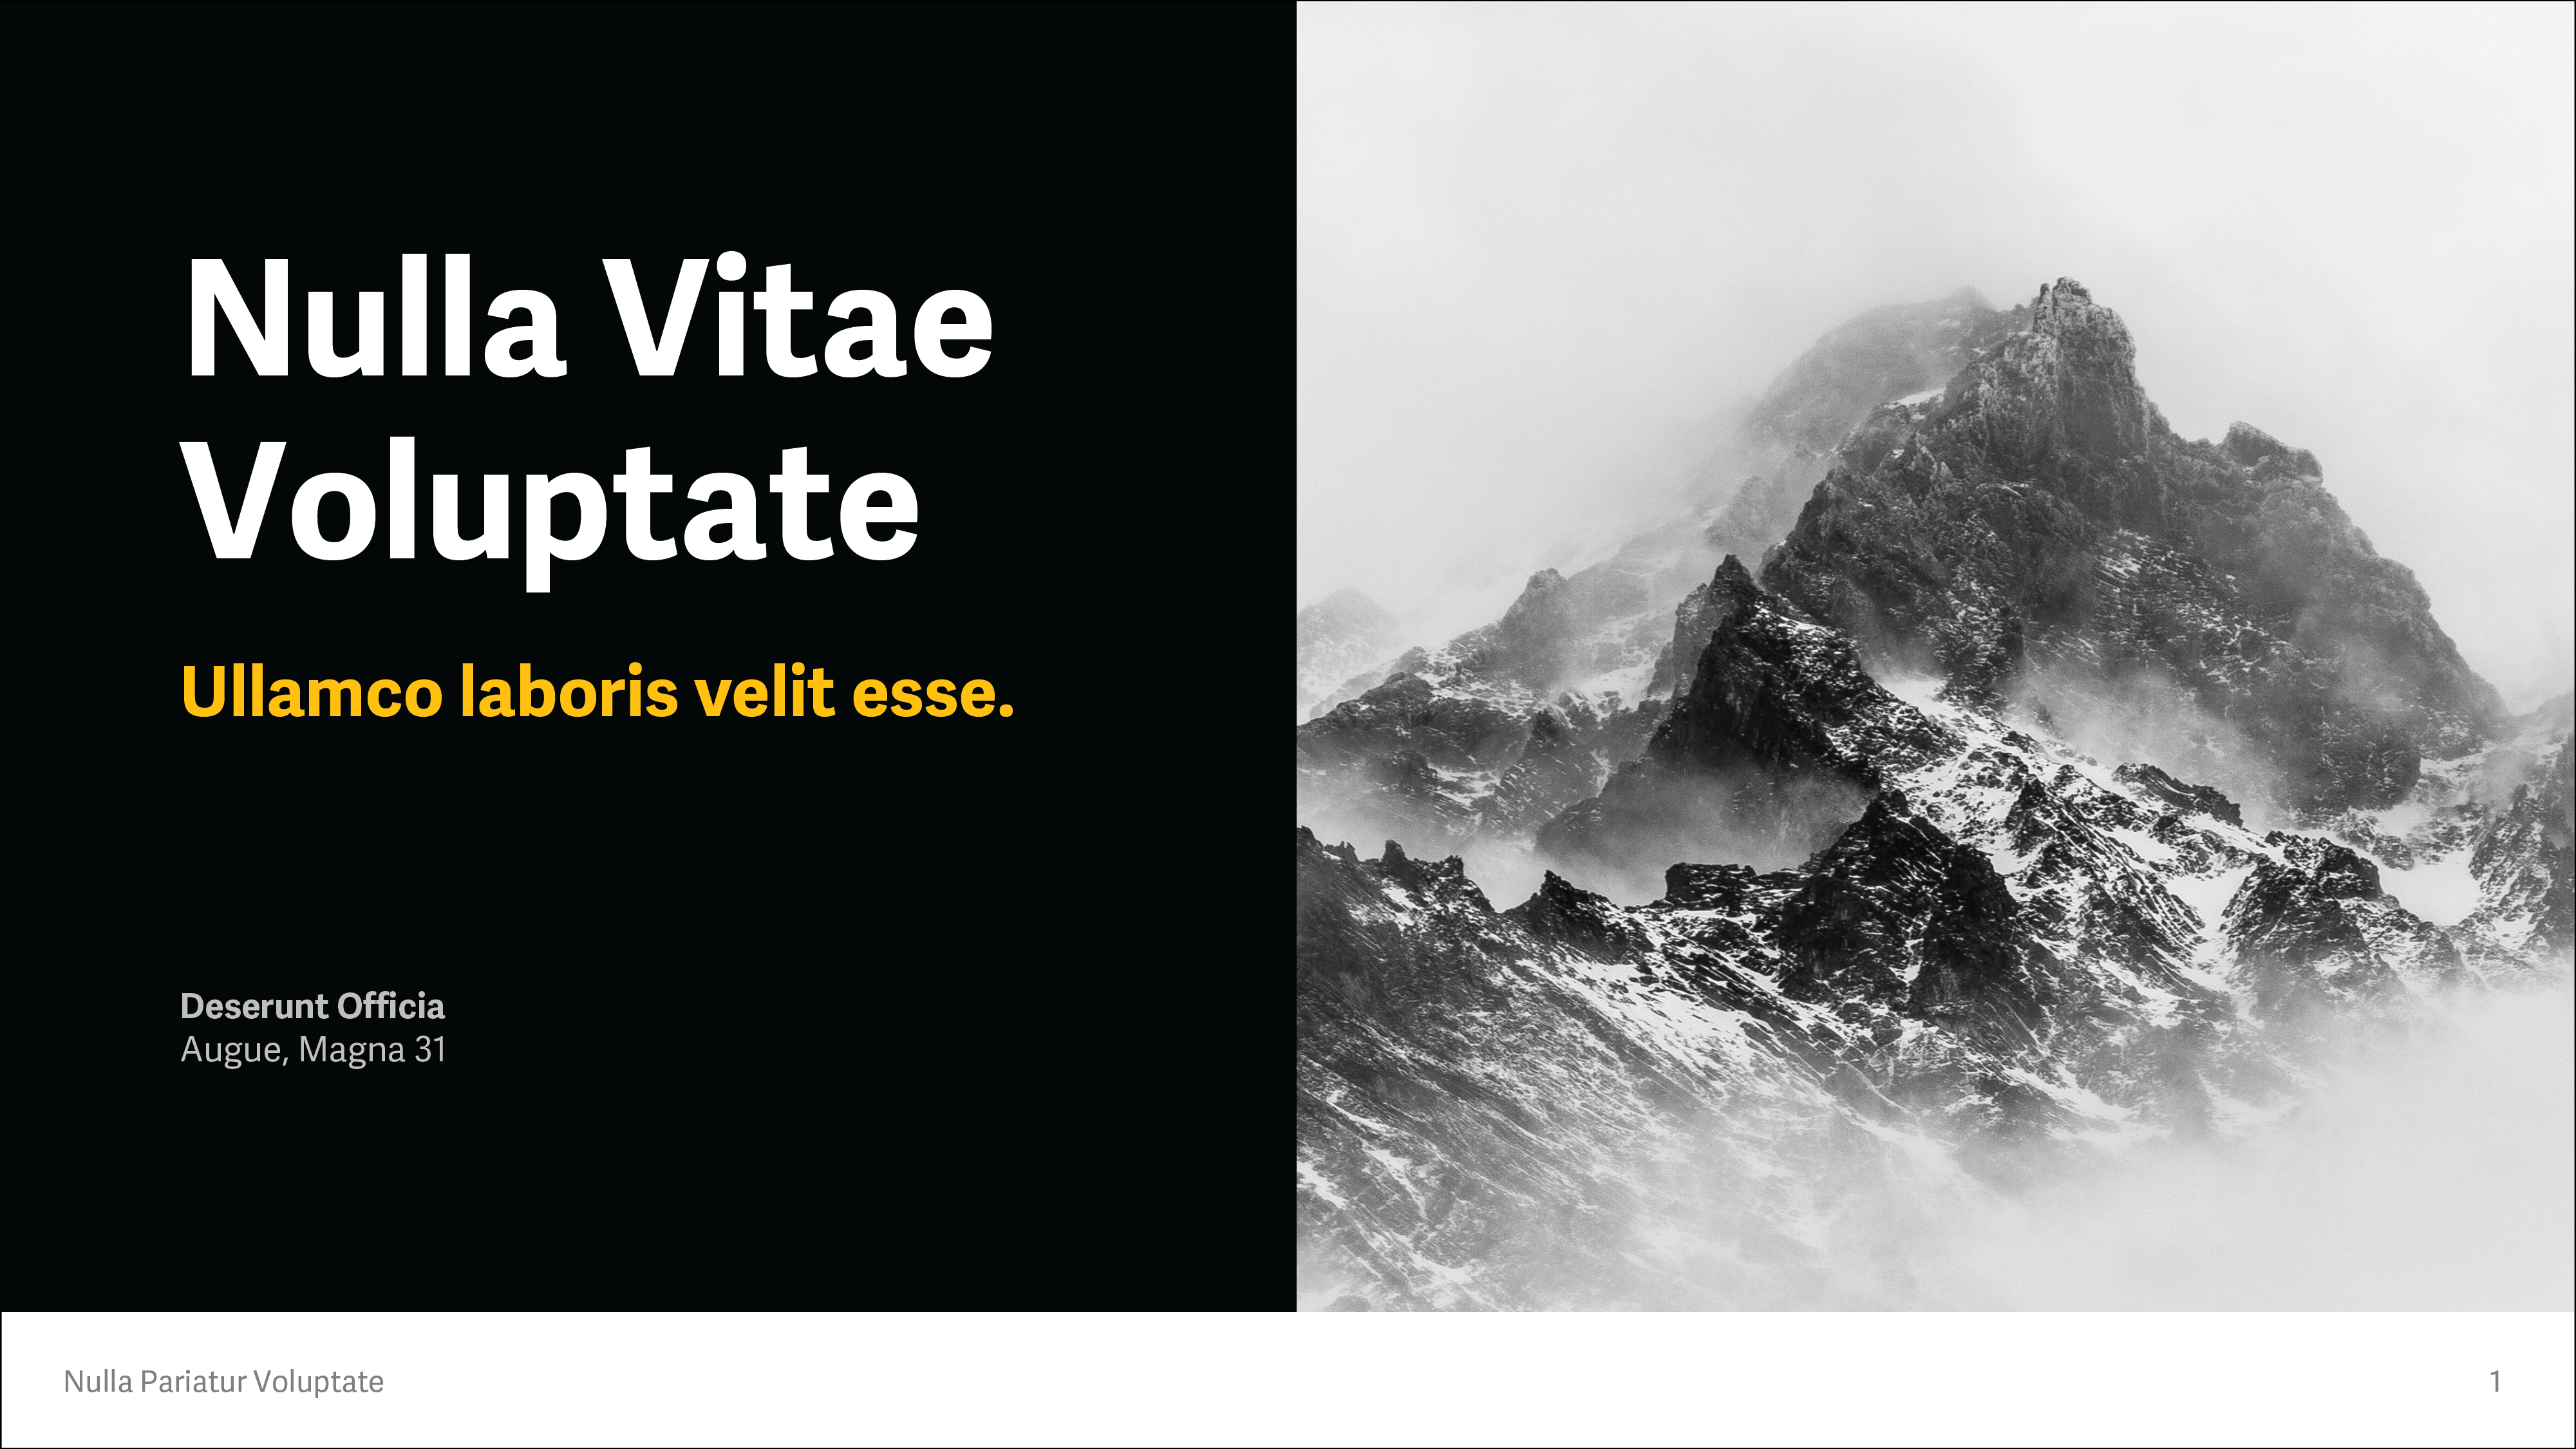
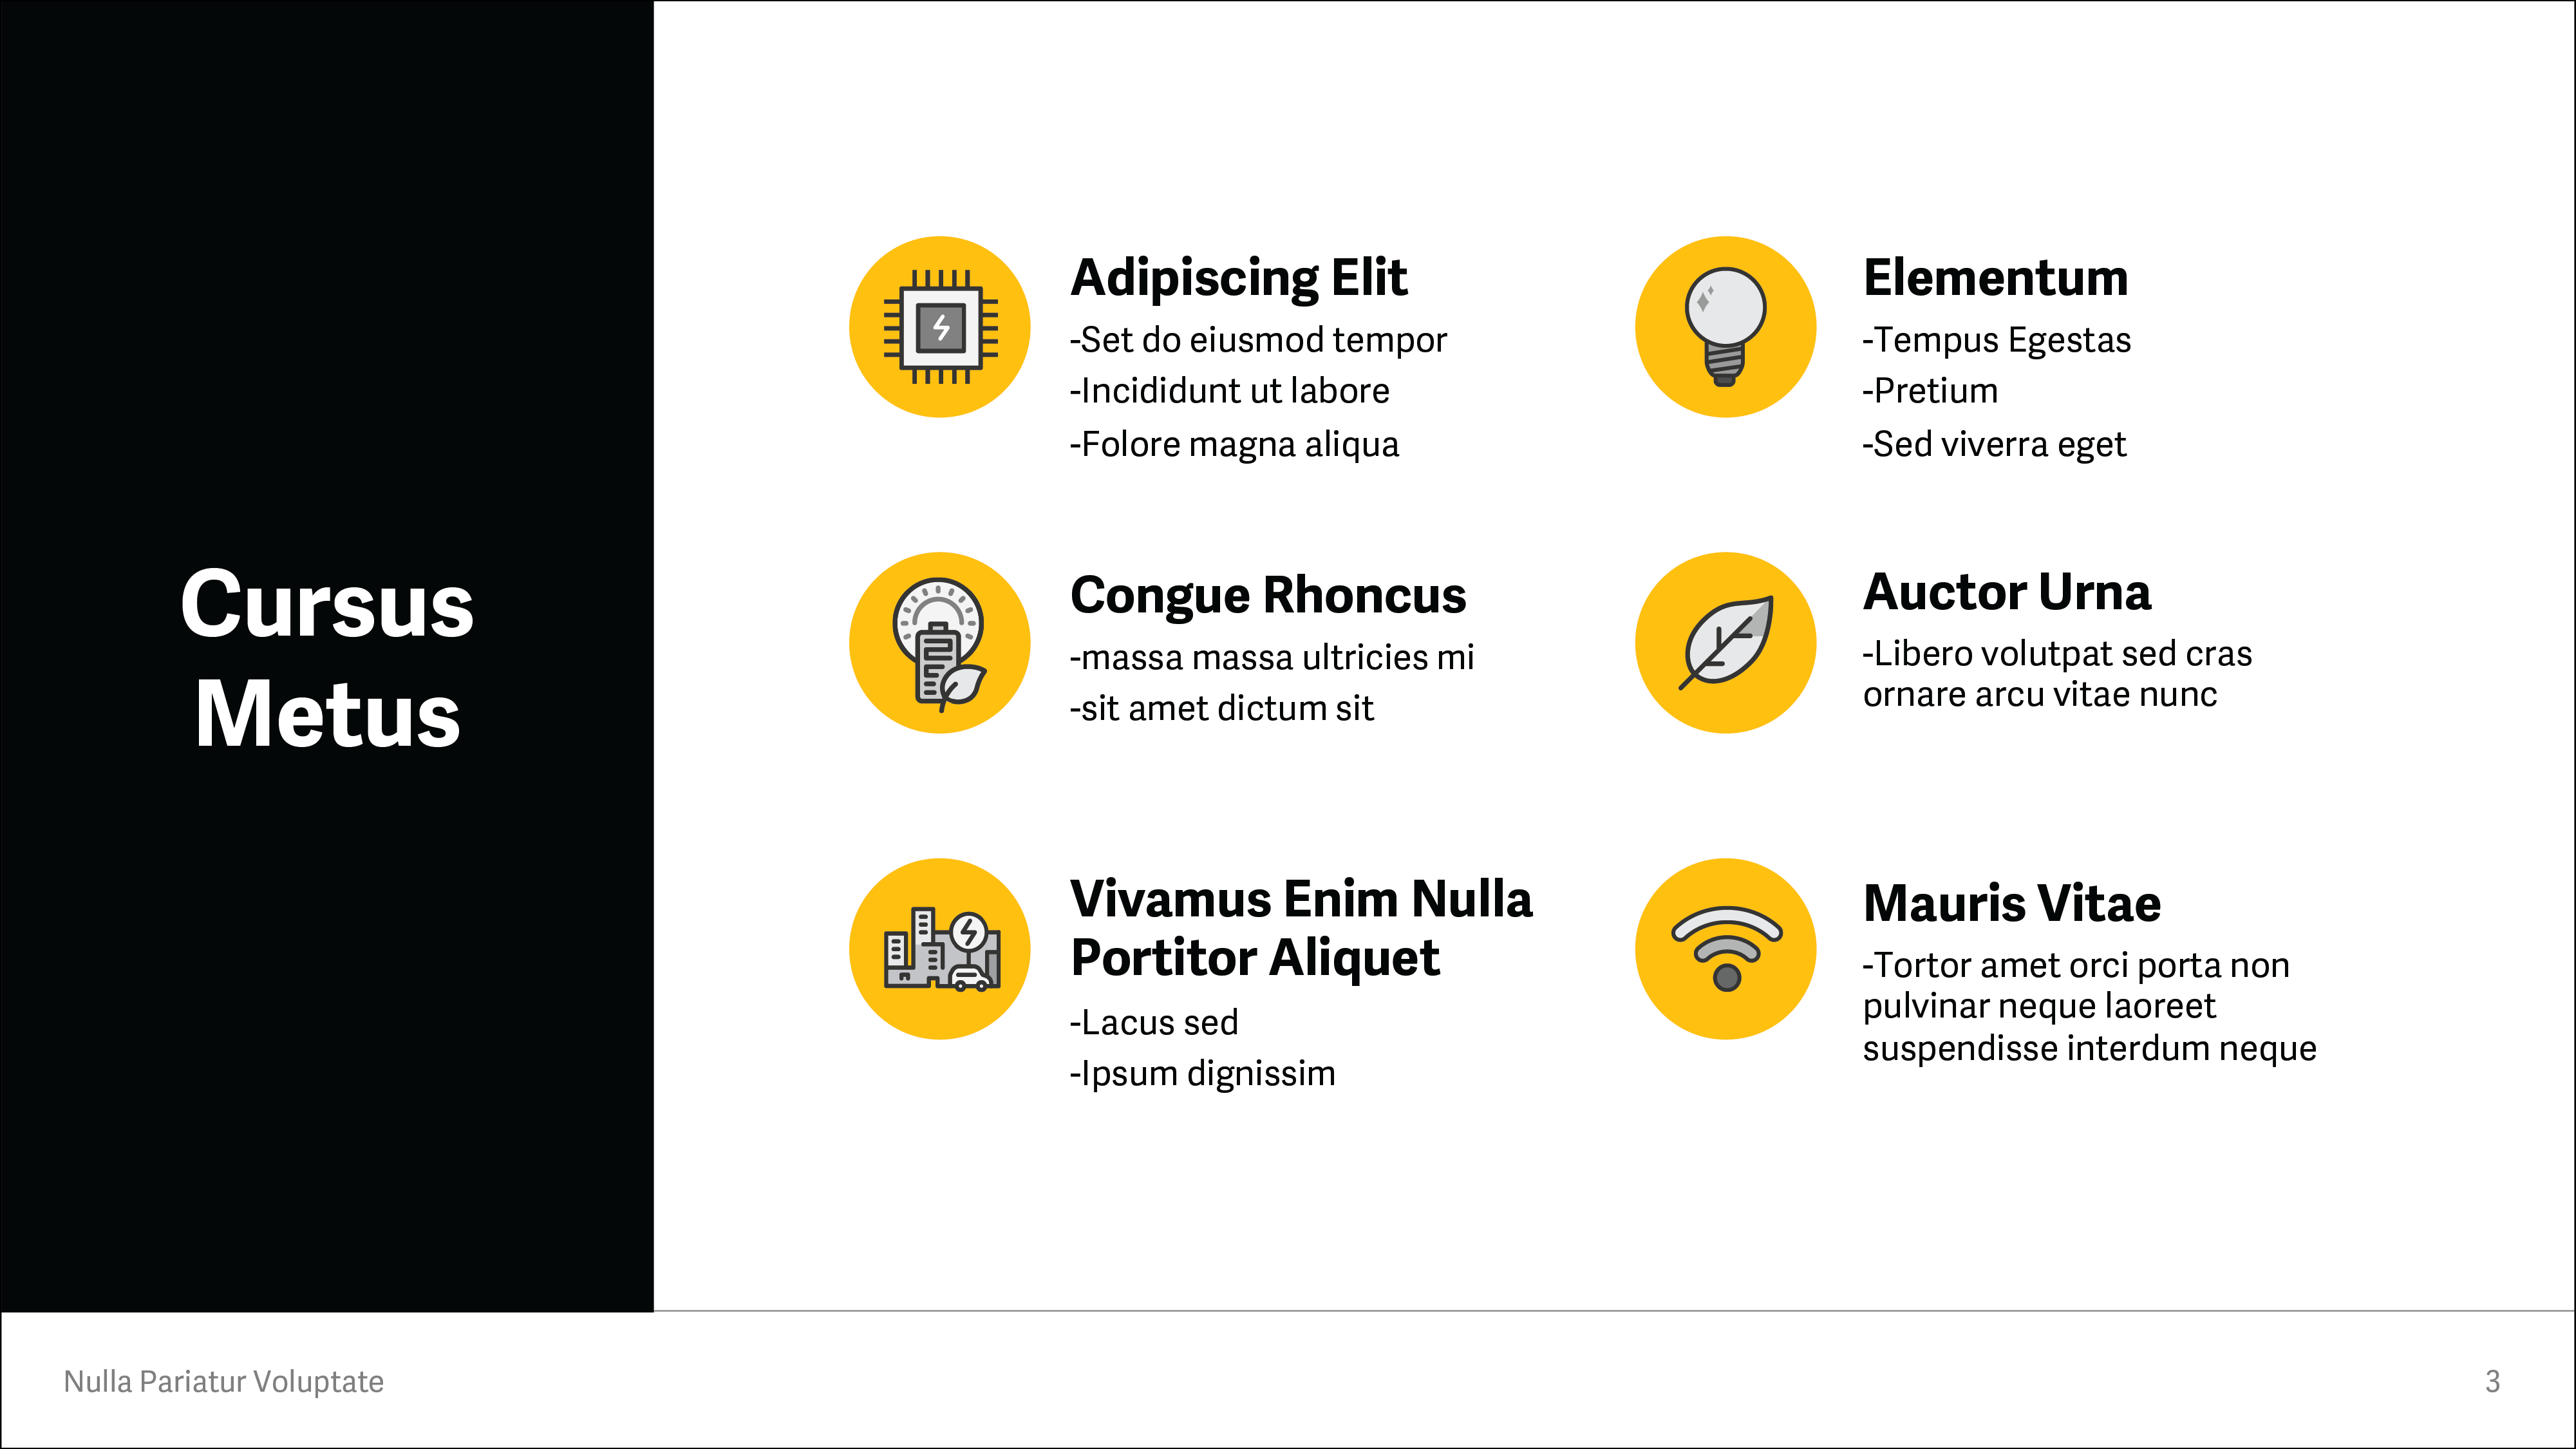
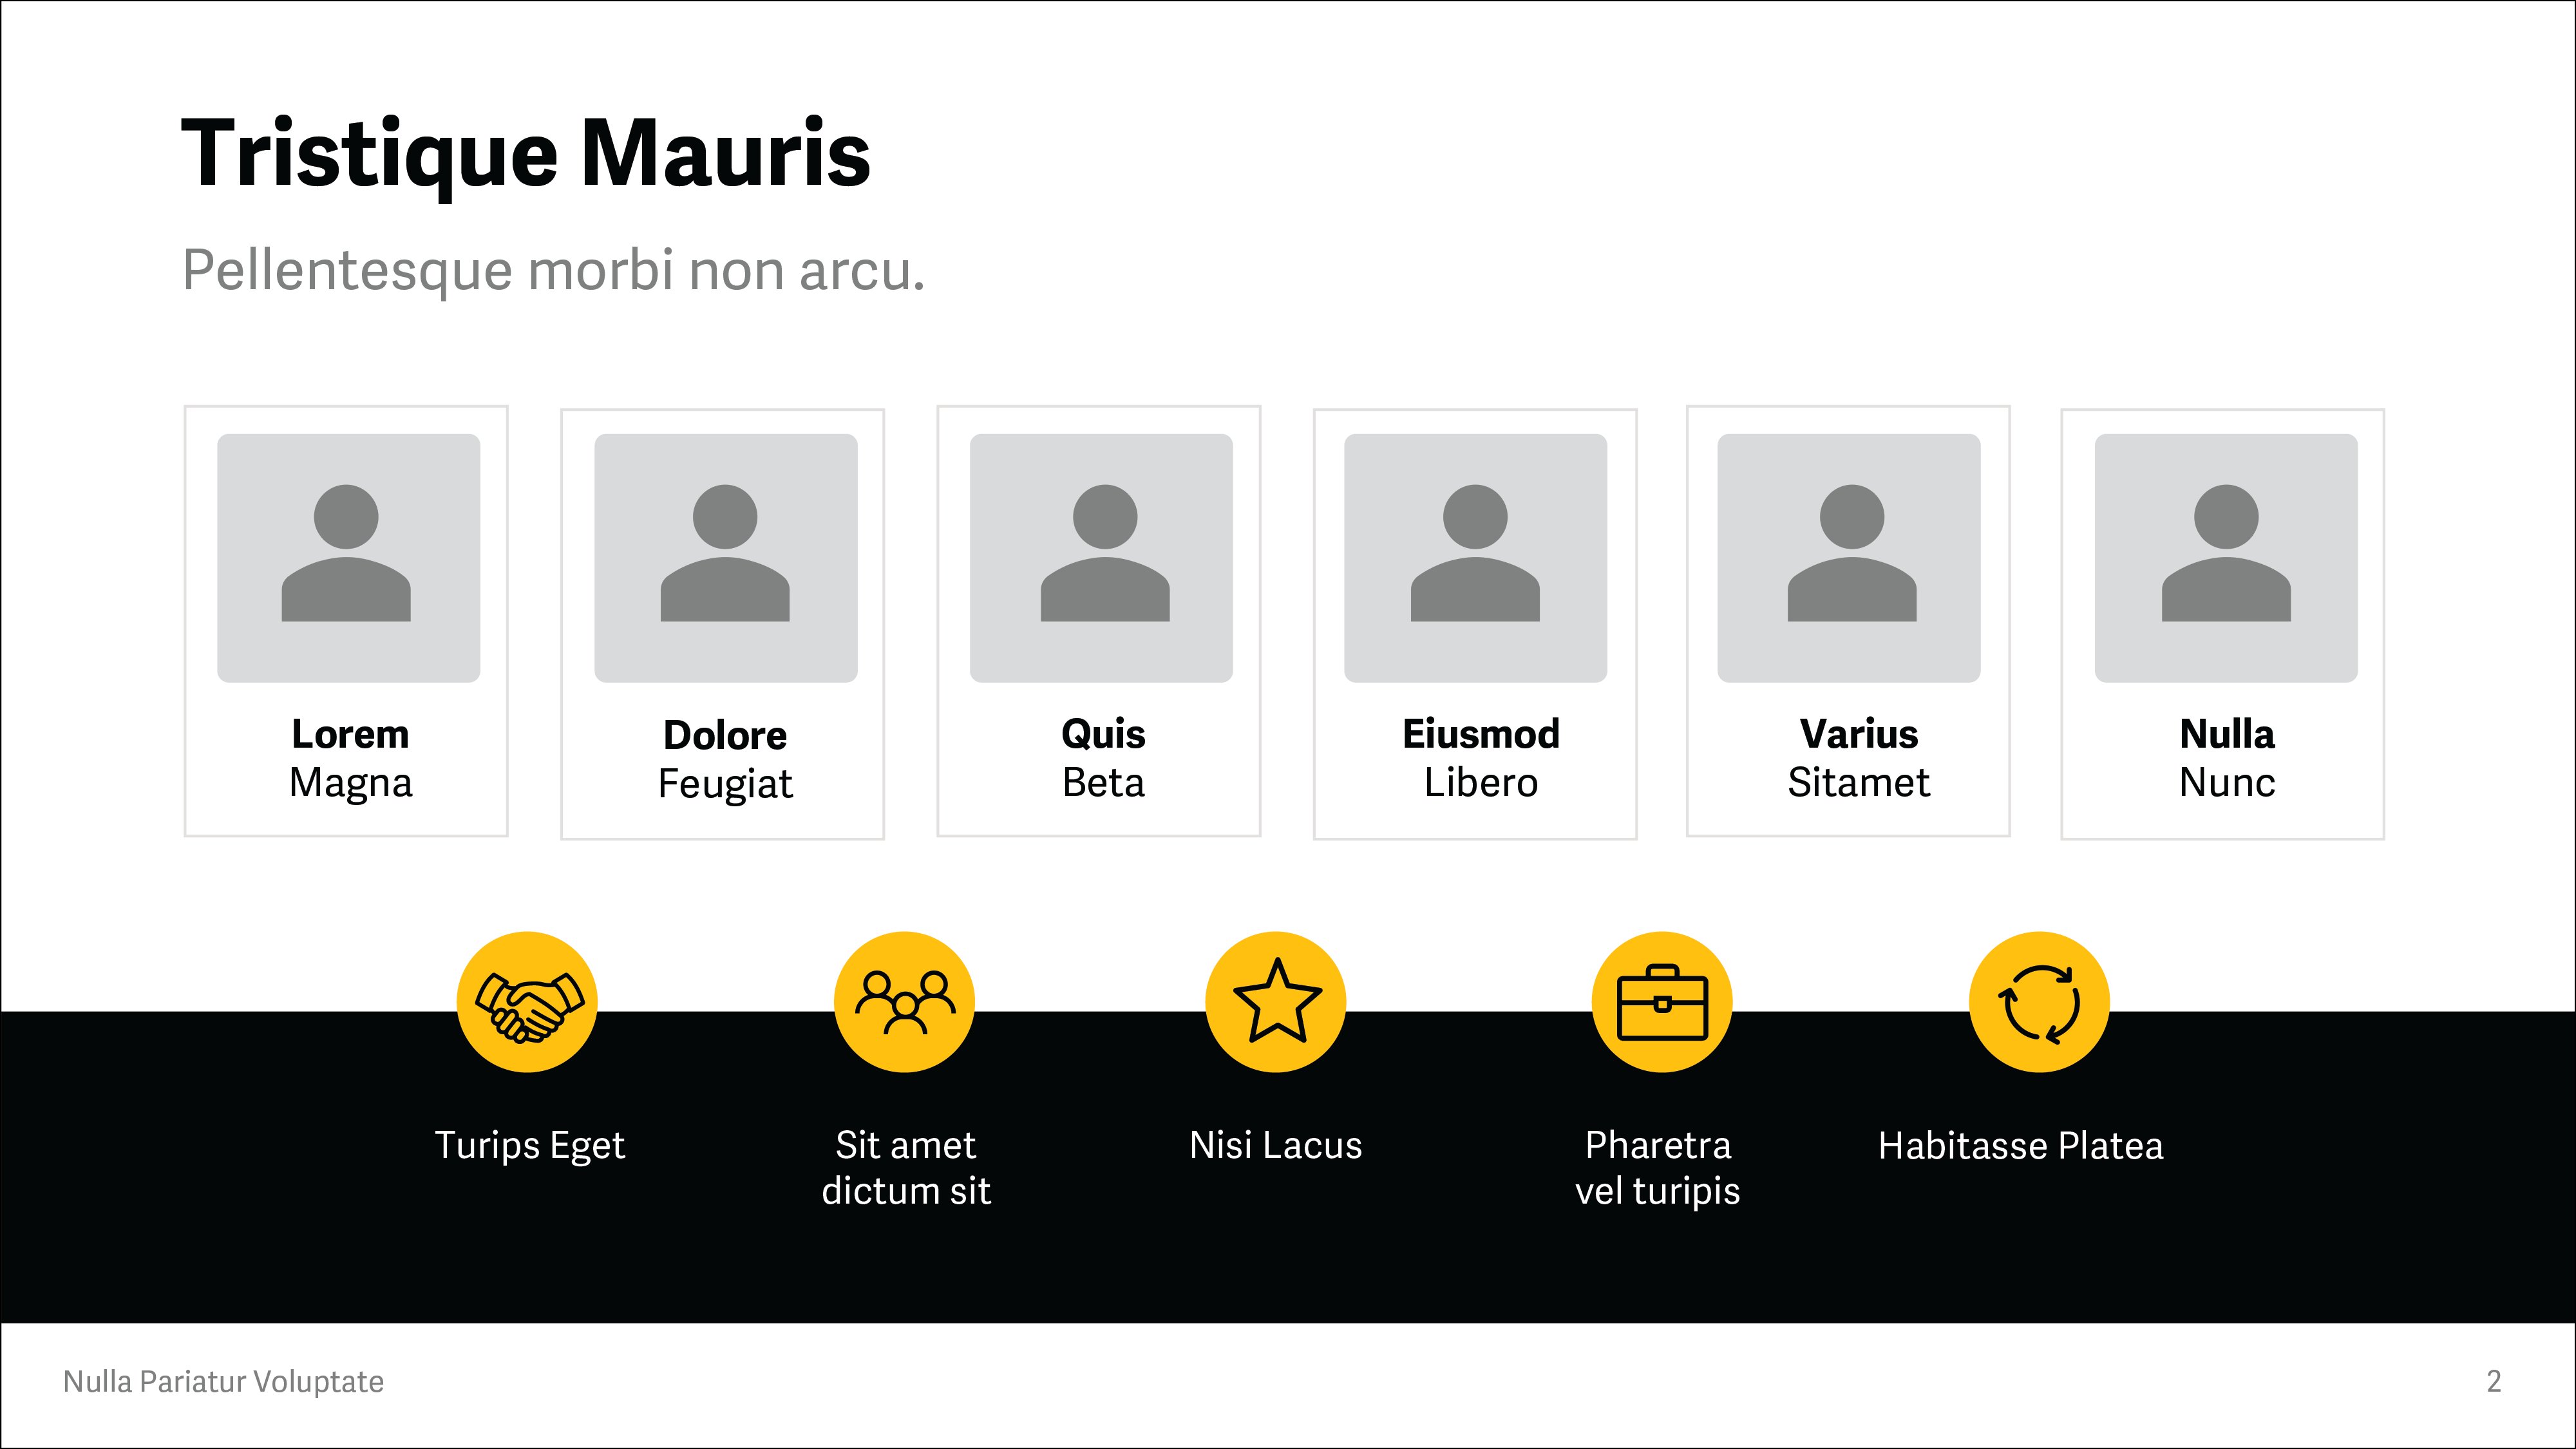
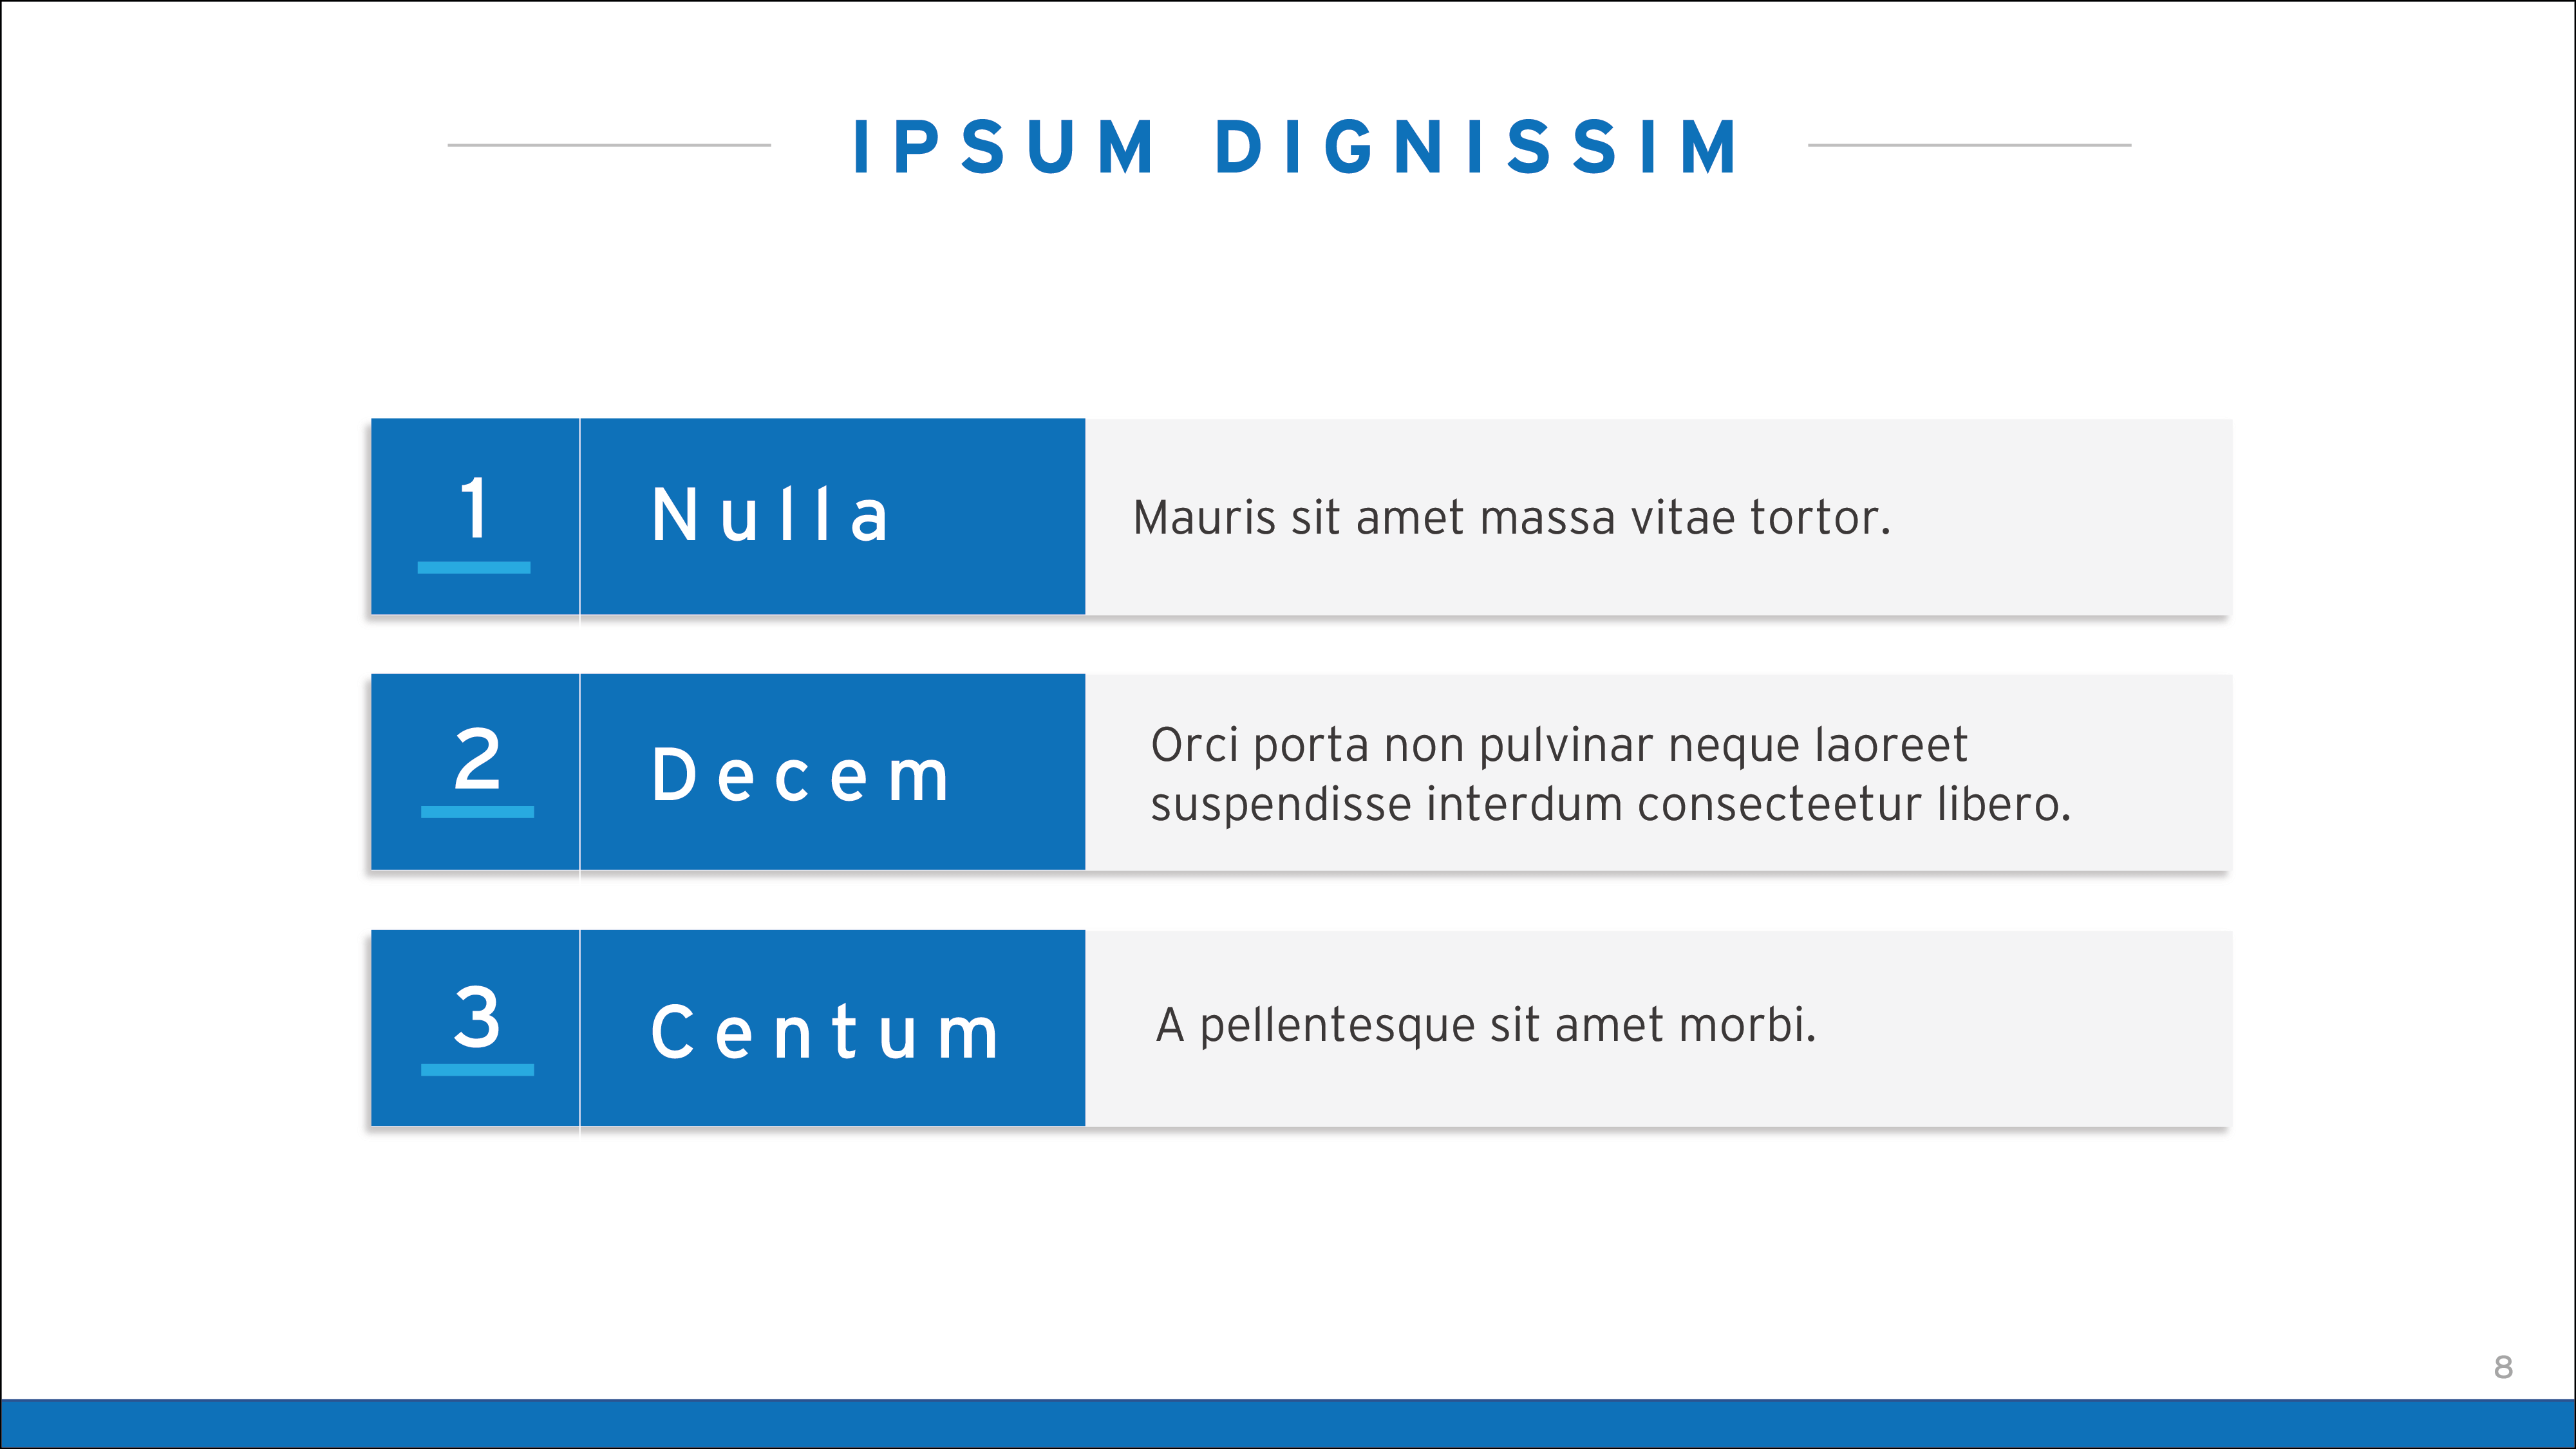
Yellow
︎︎︎National JournalDesigned a fully editable powerpoint presentation from scratch for company E.
This presentation has been edited heavily, to showcase publicly.
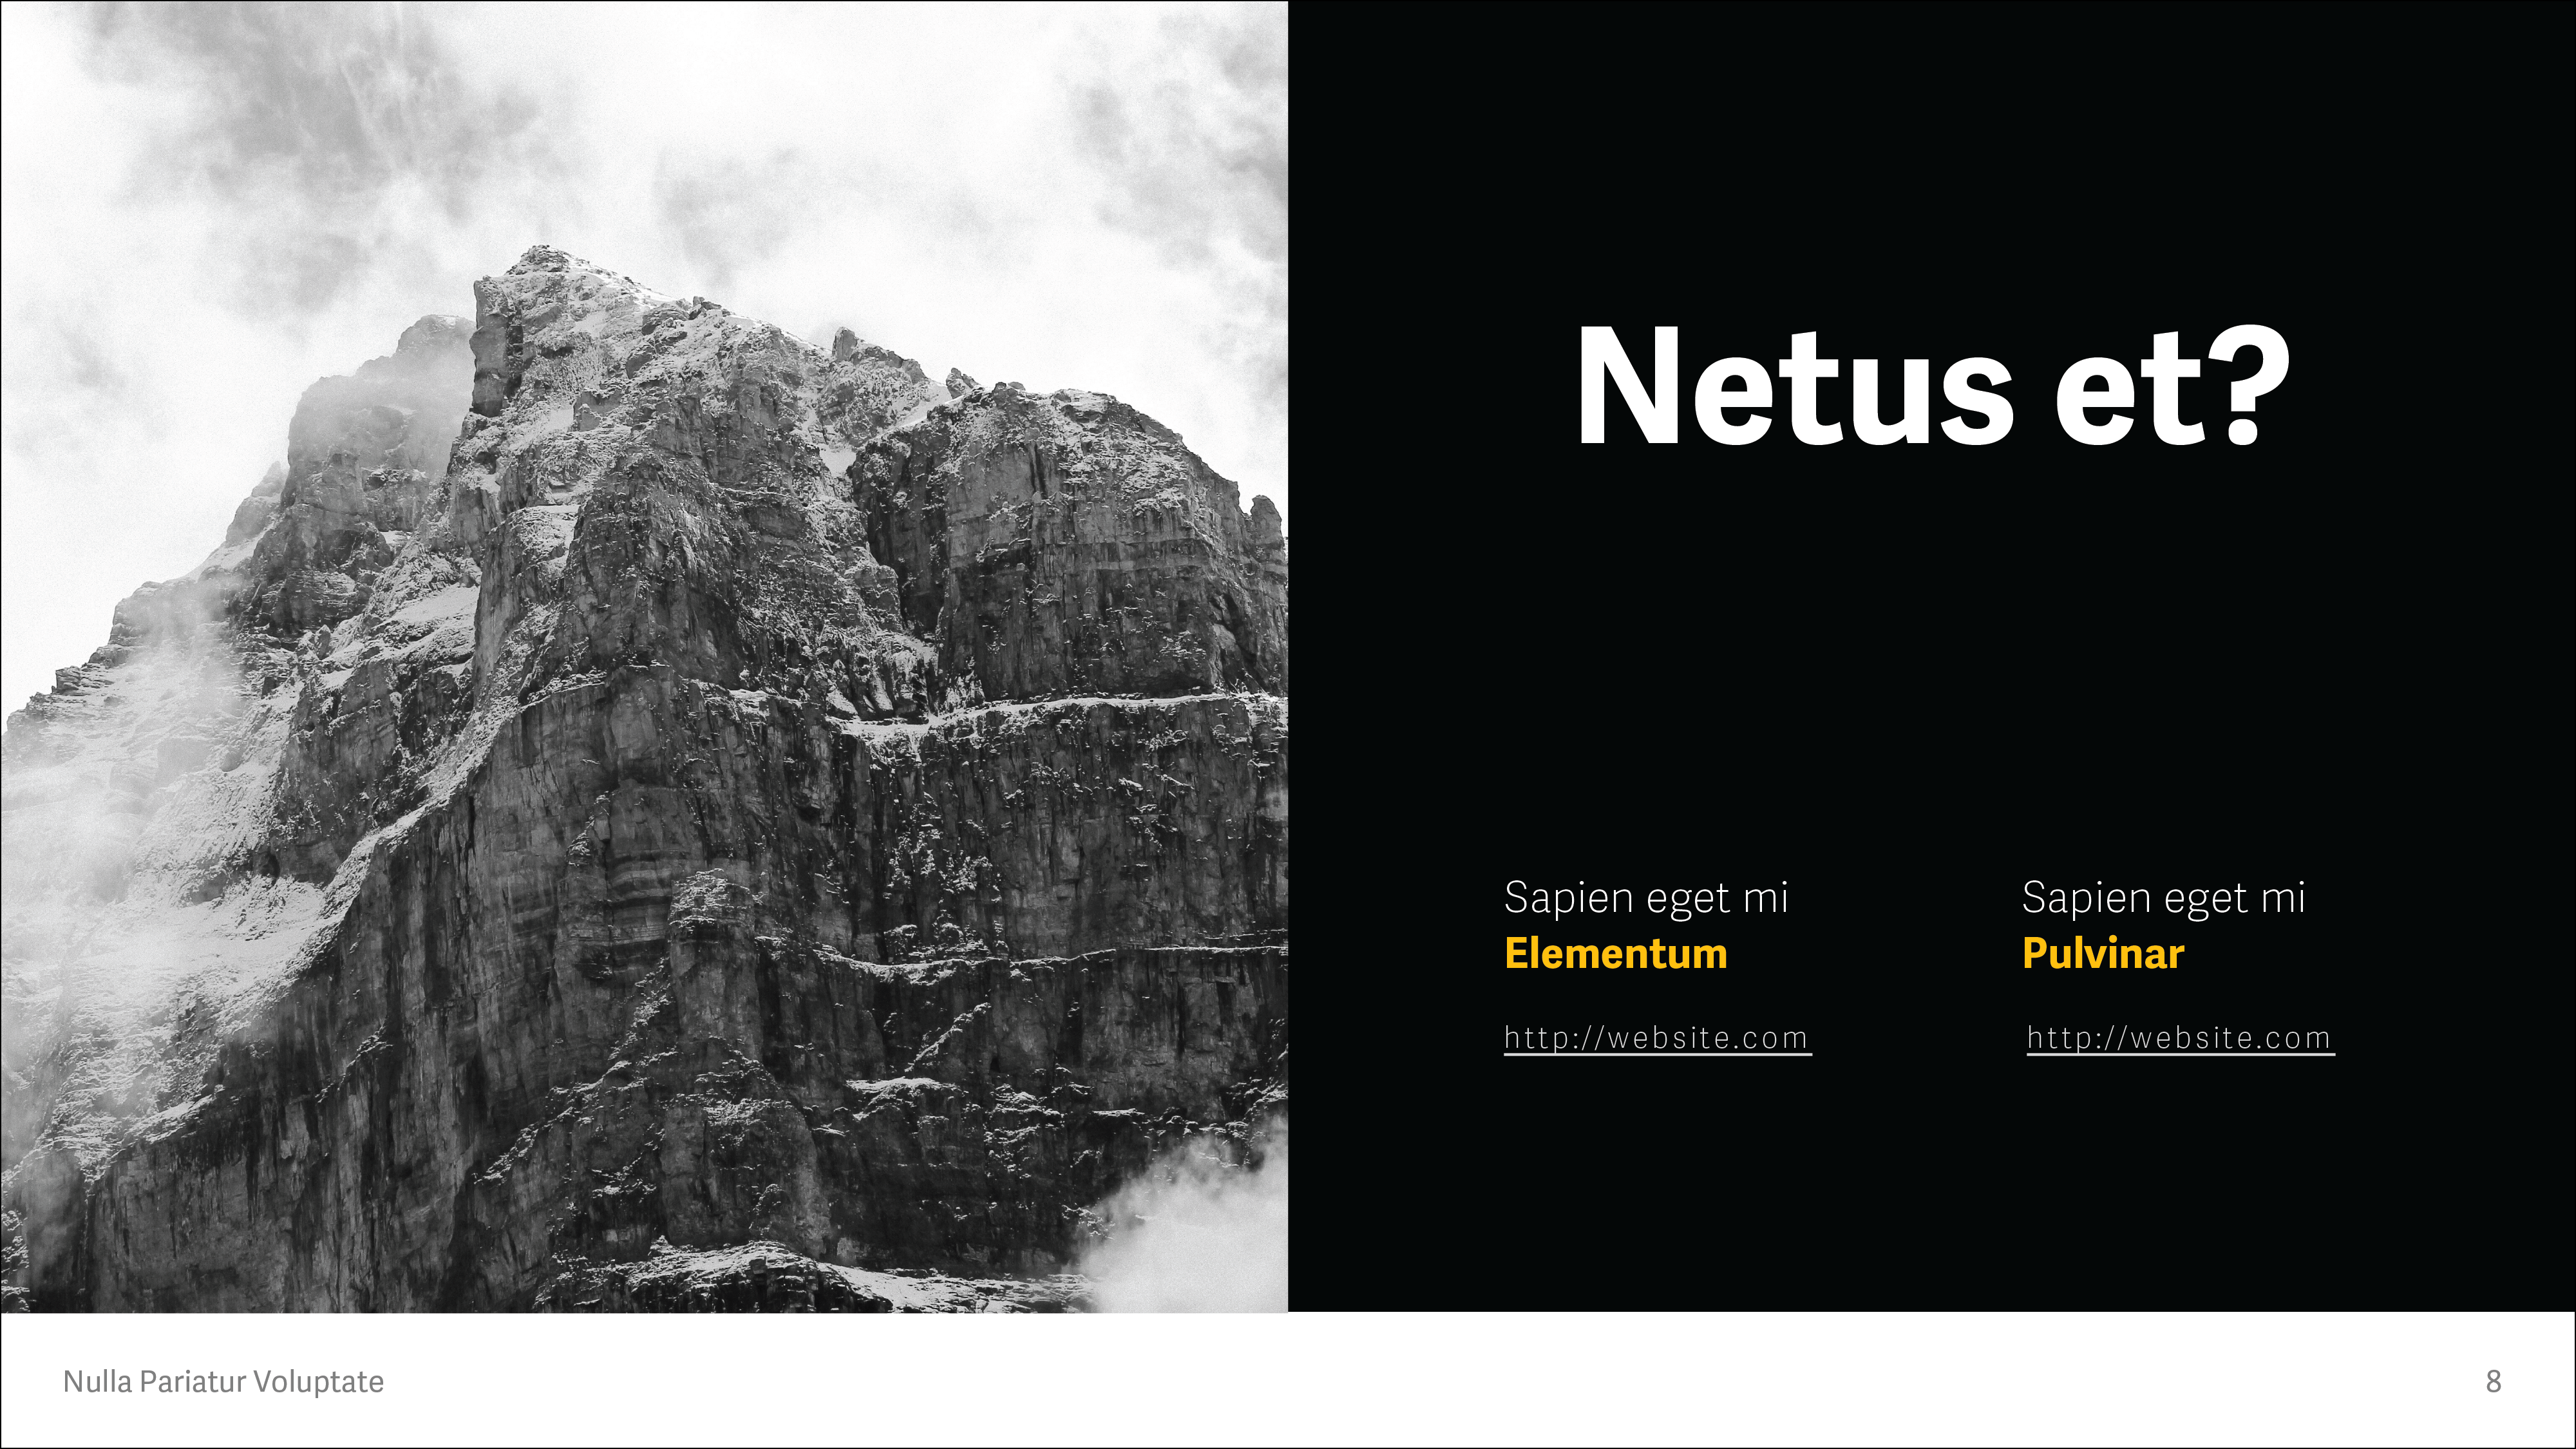
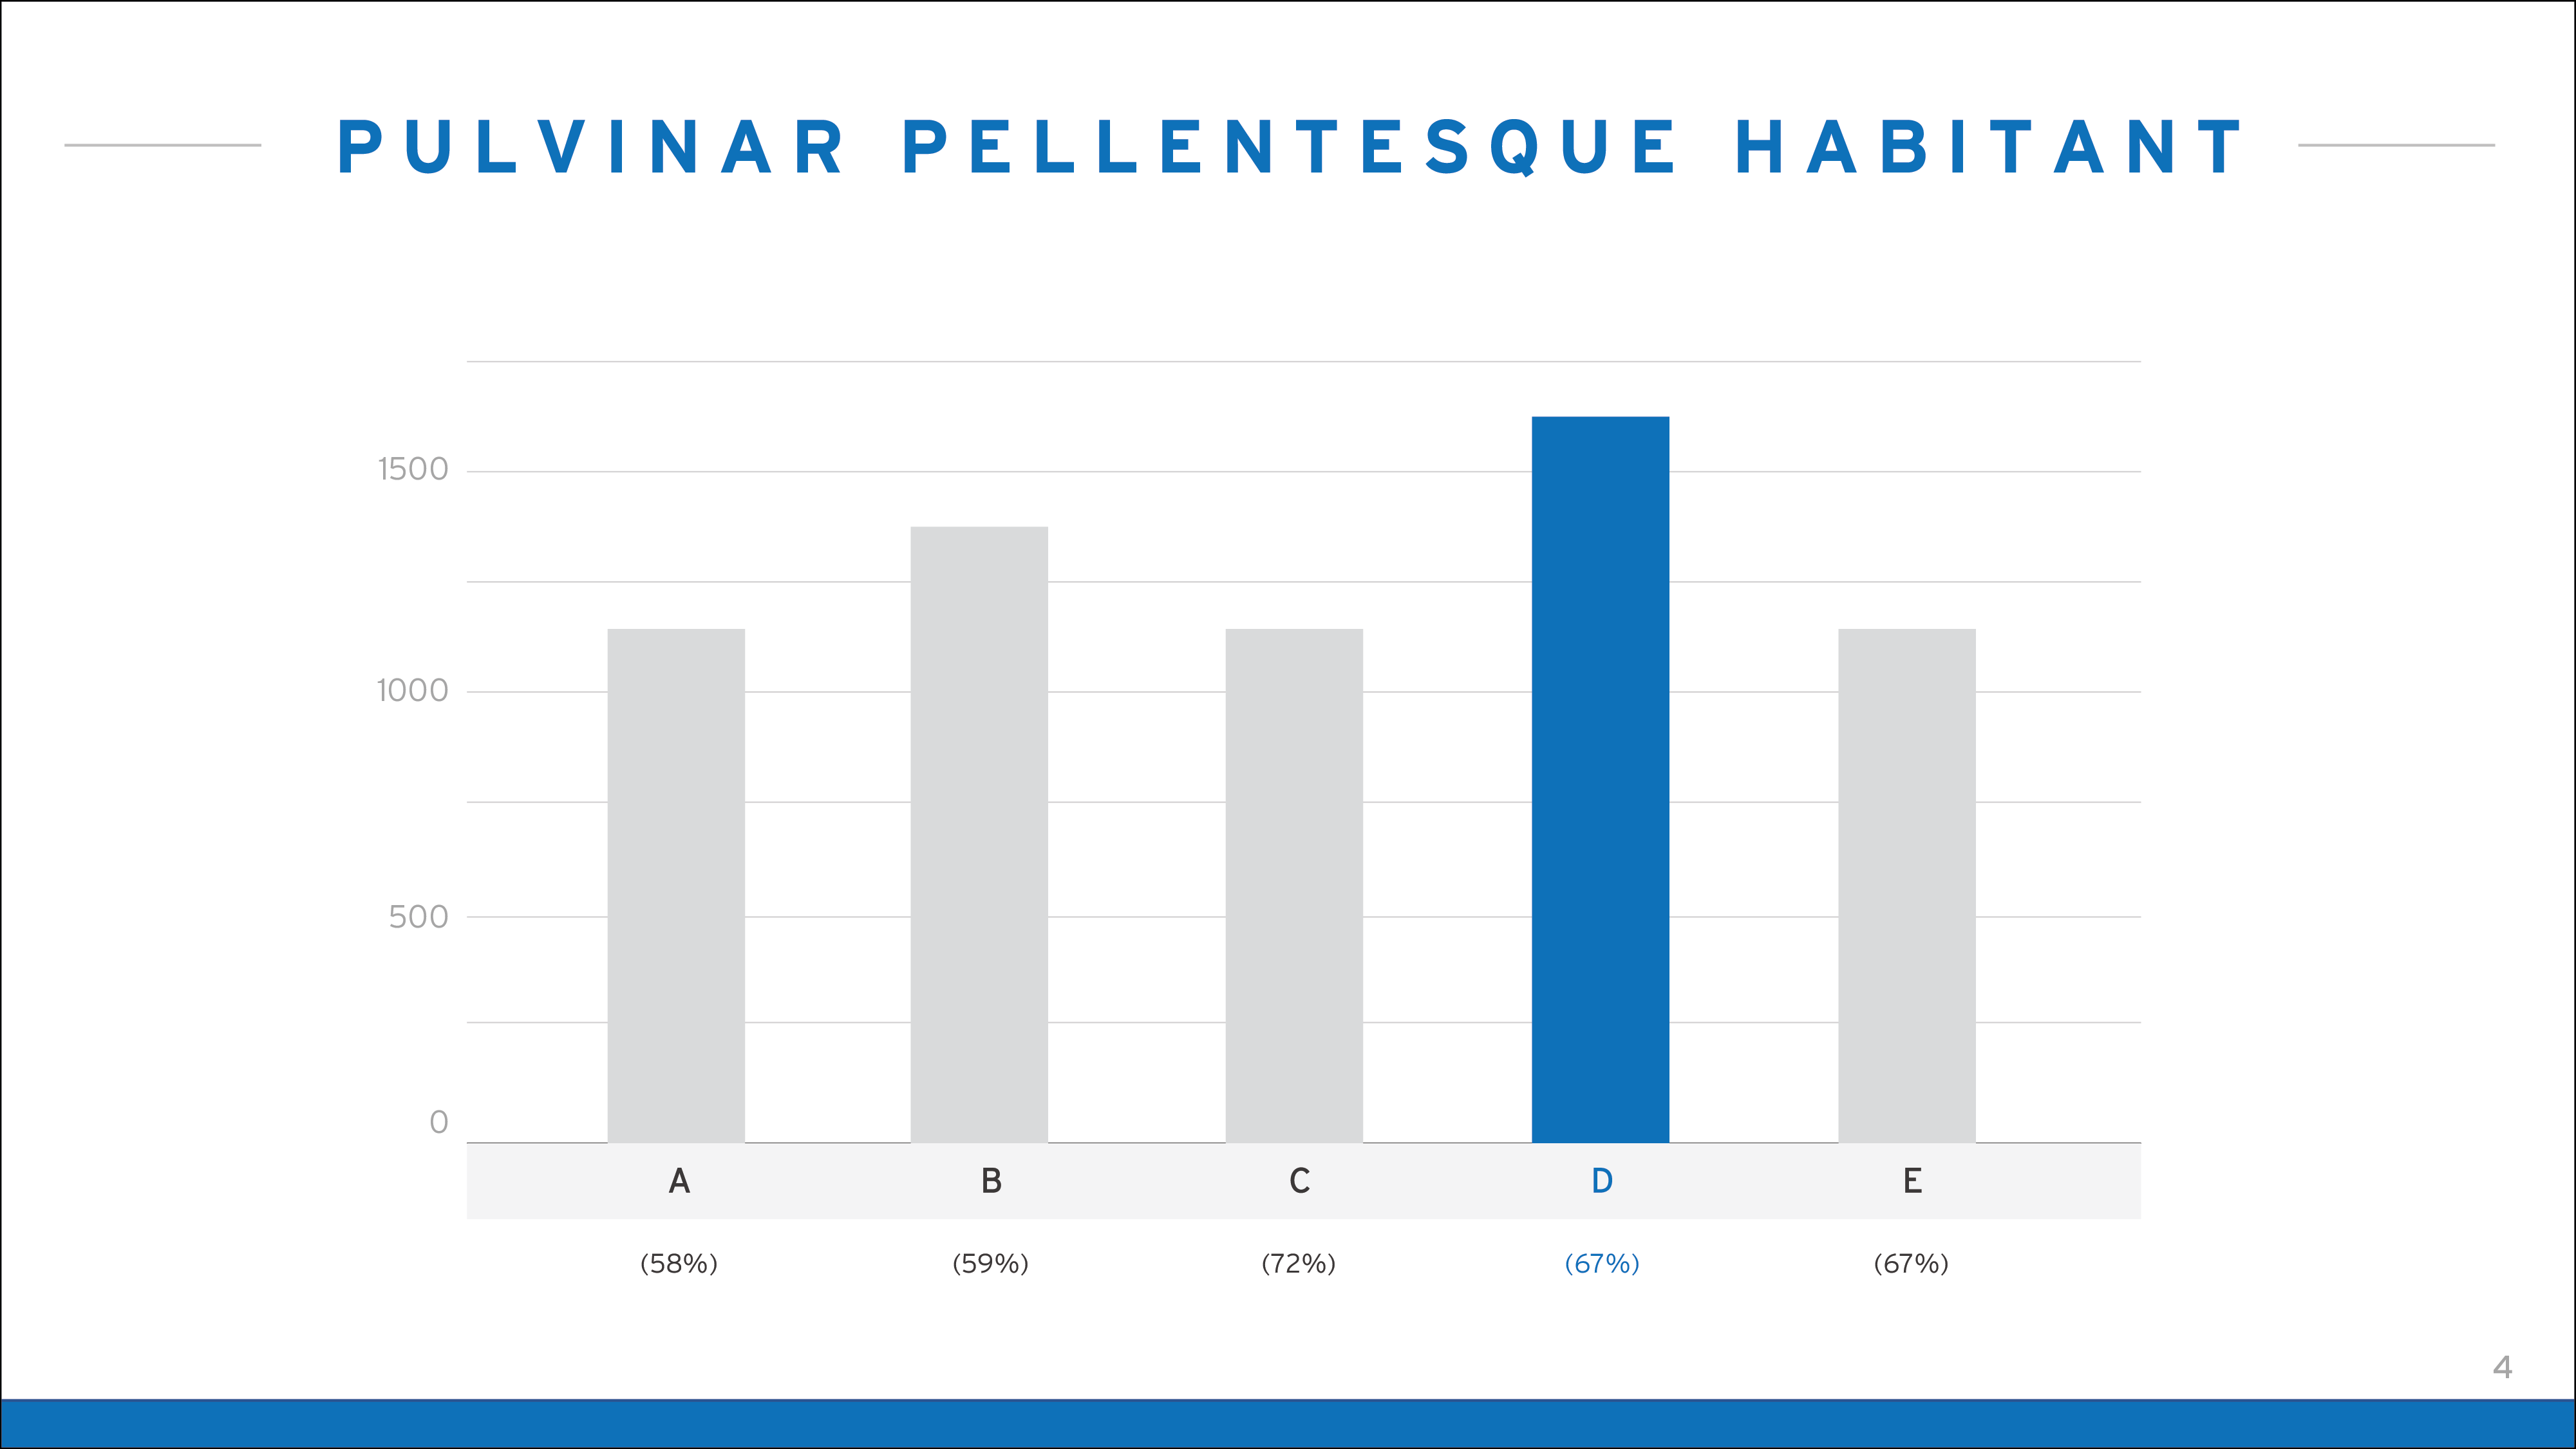
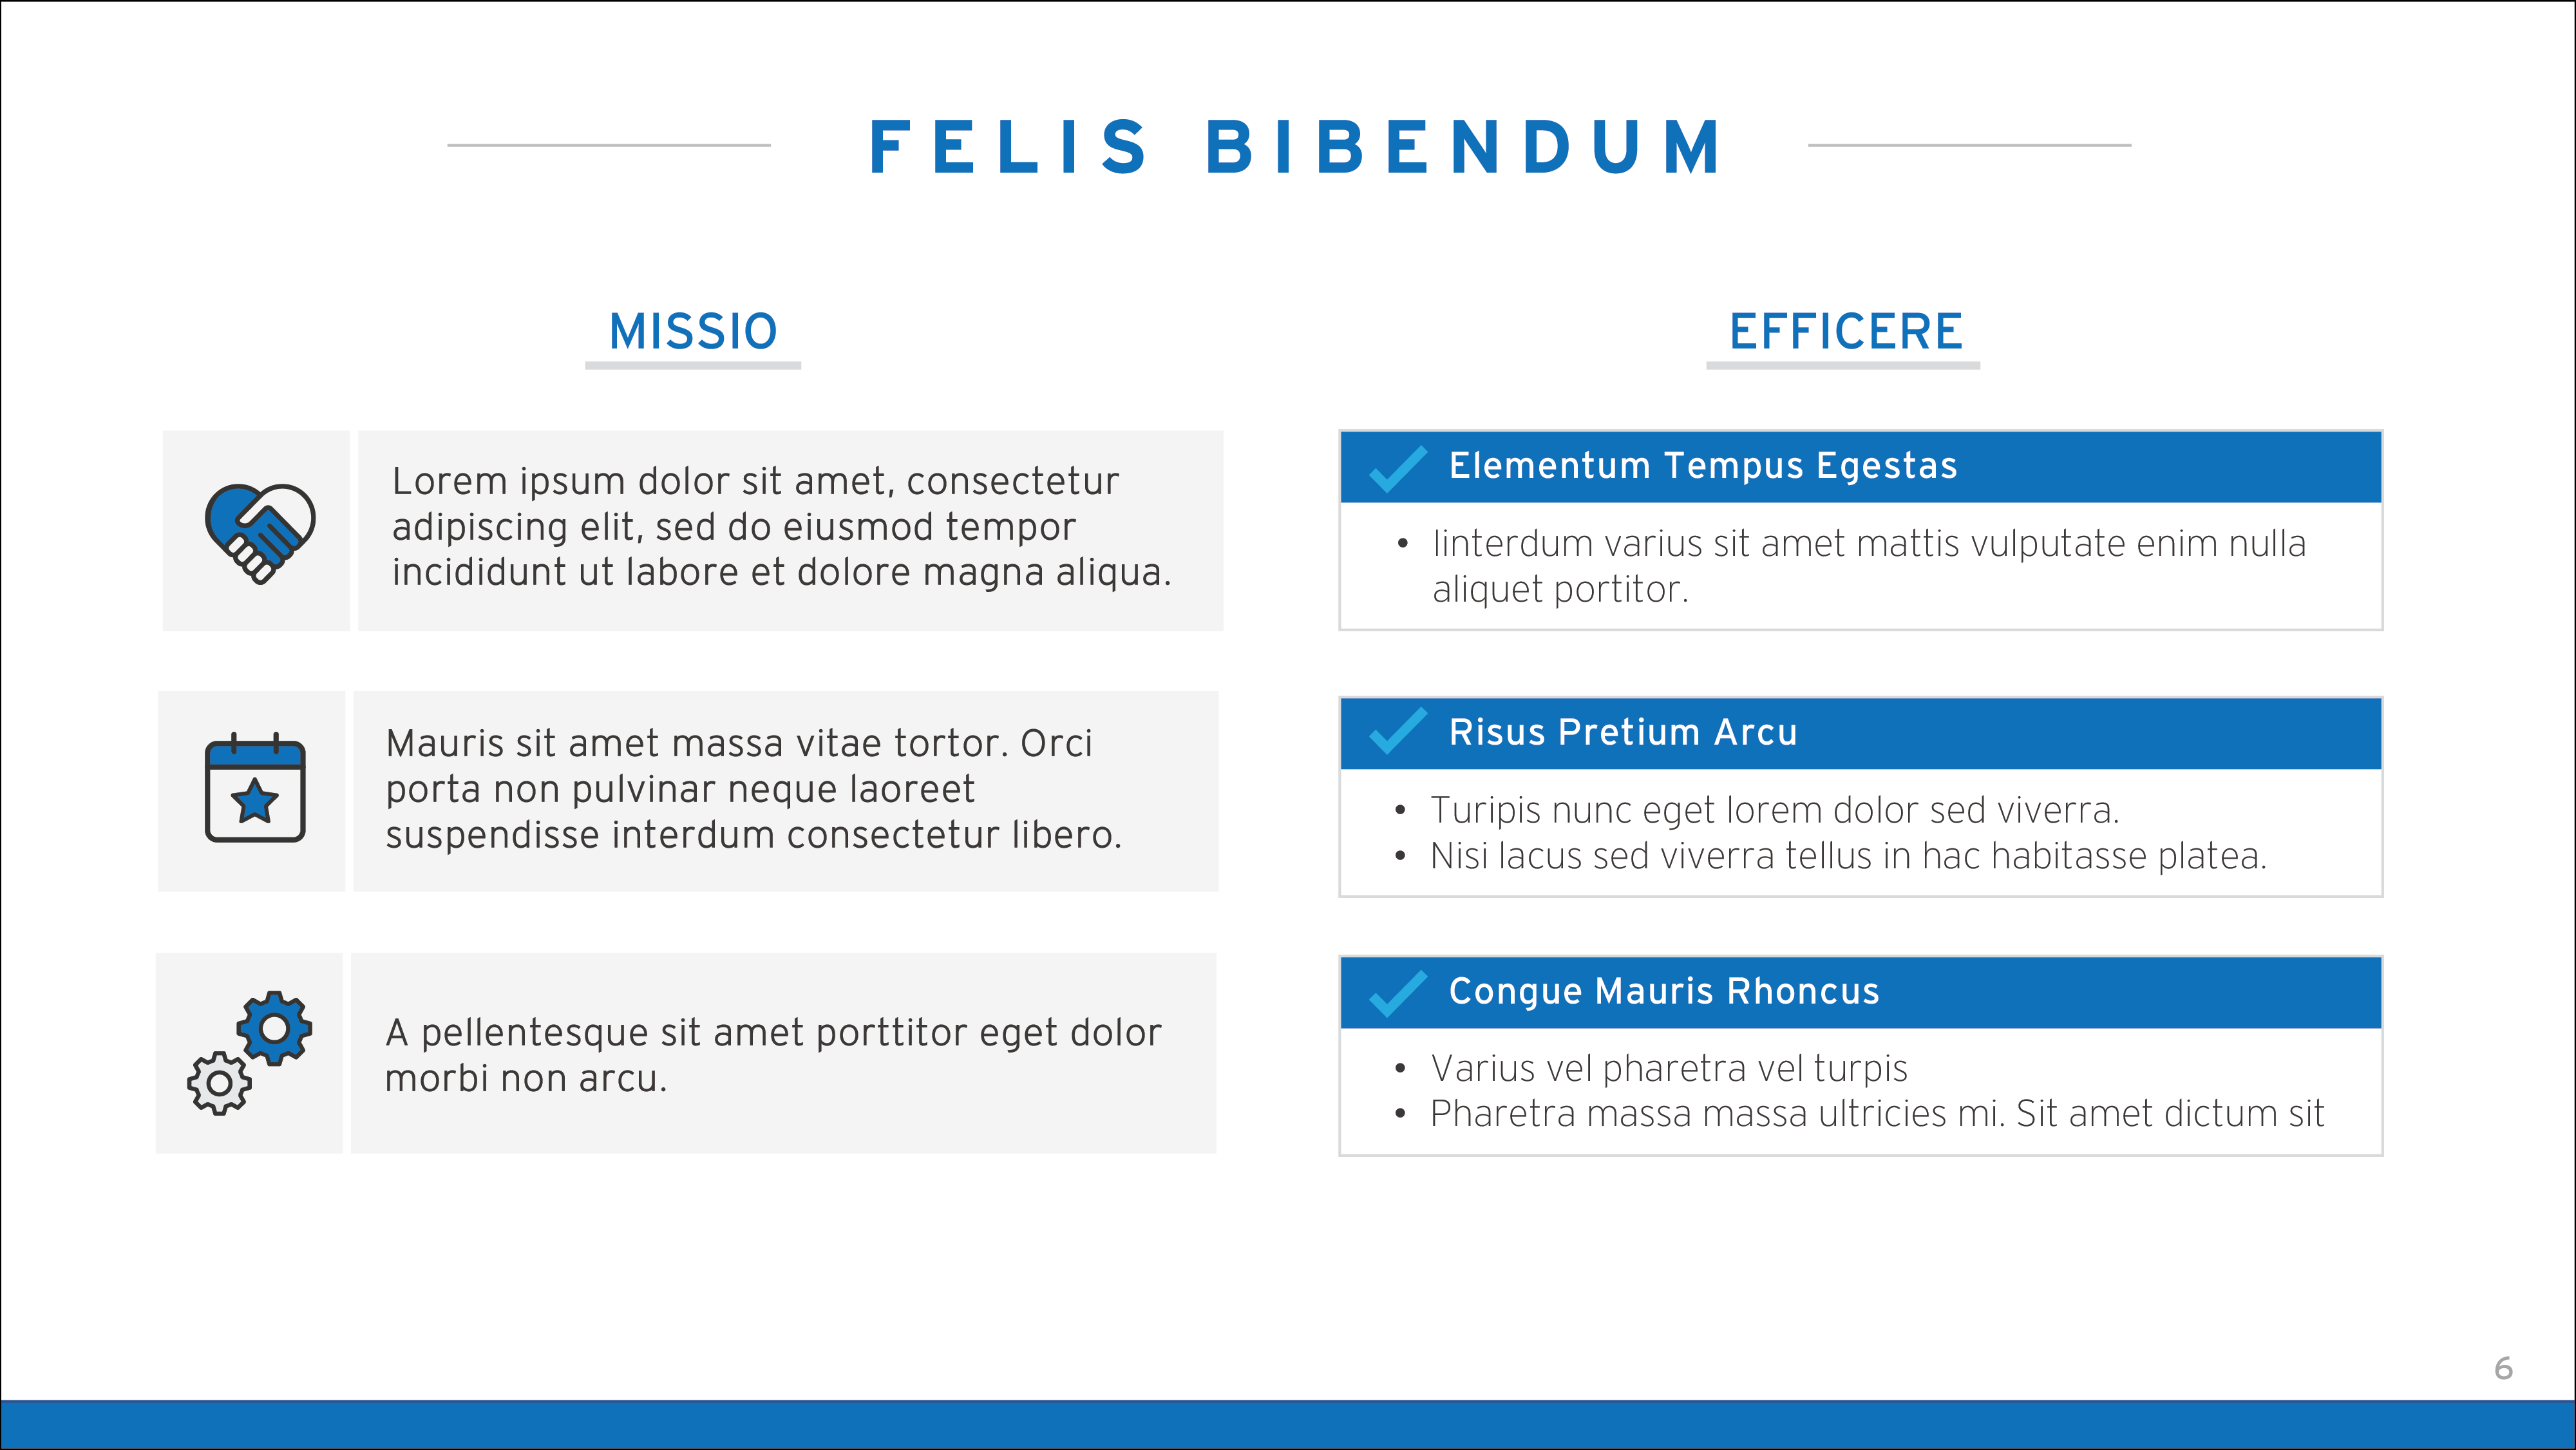
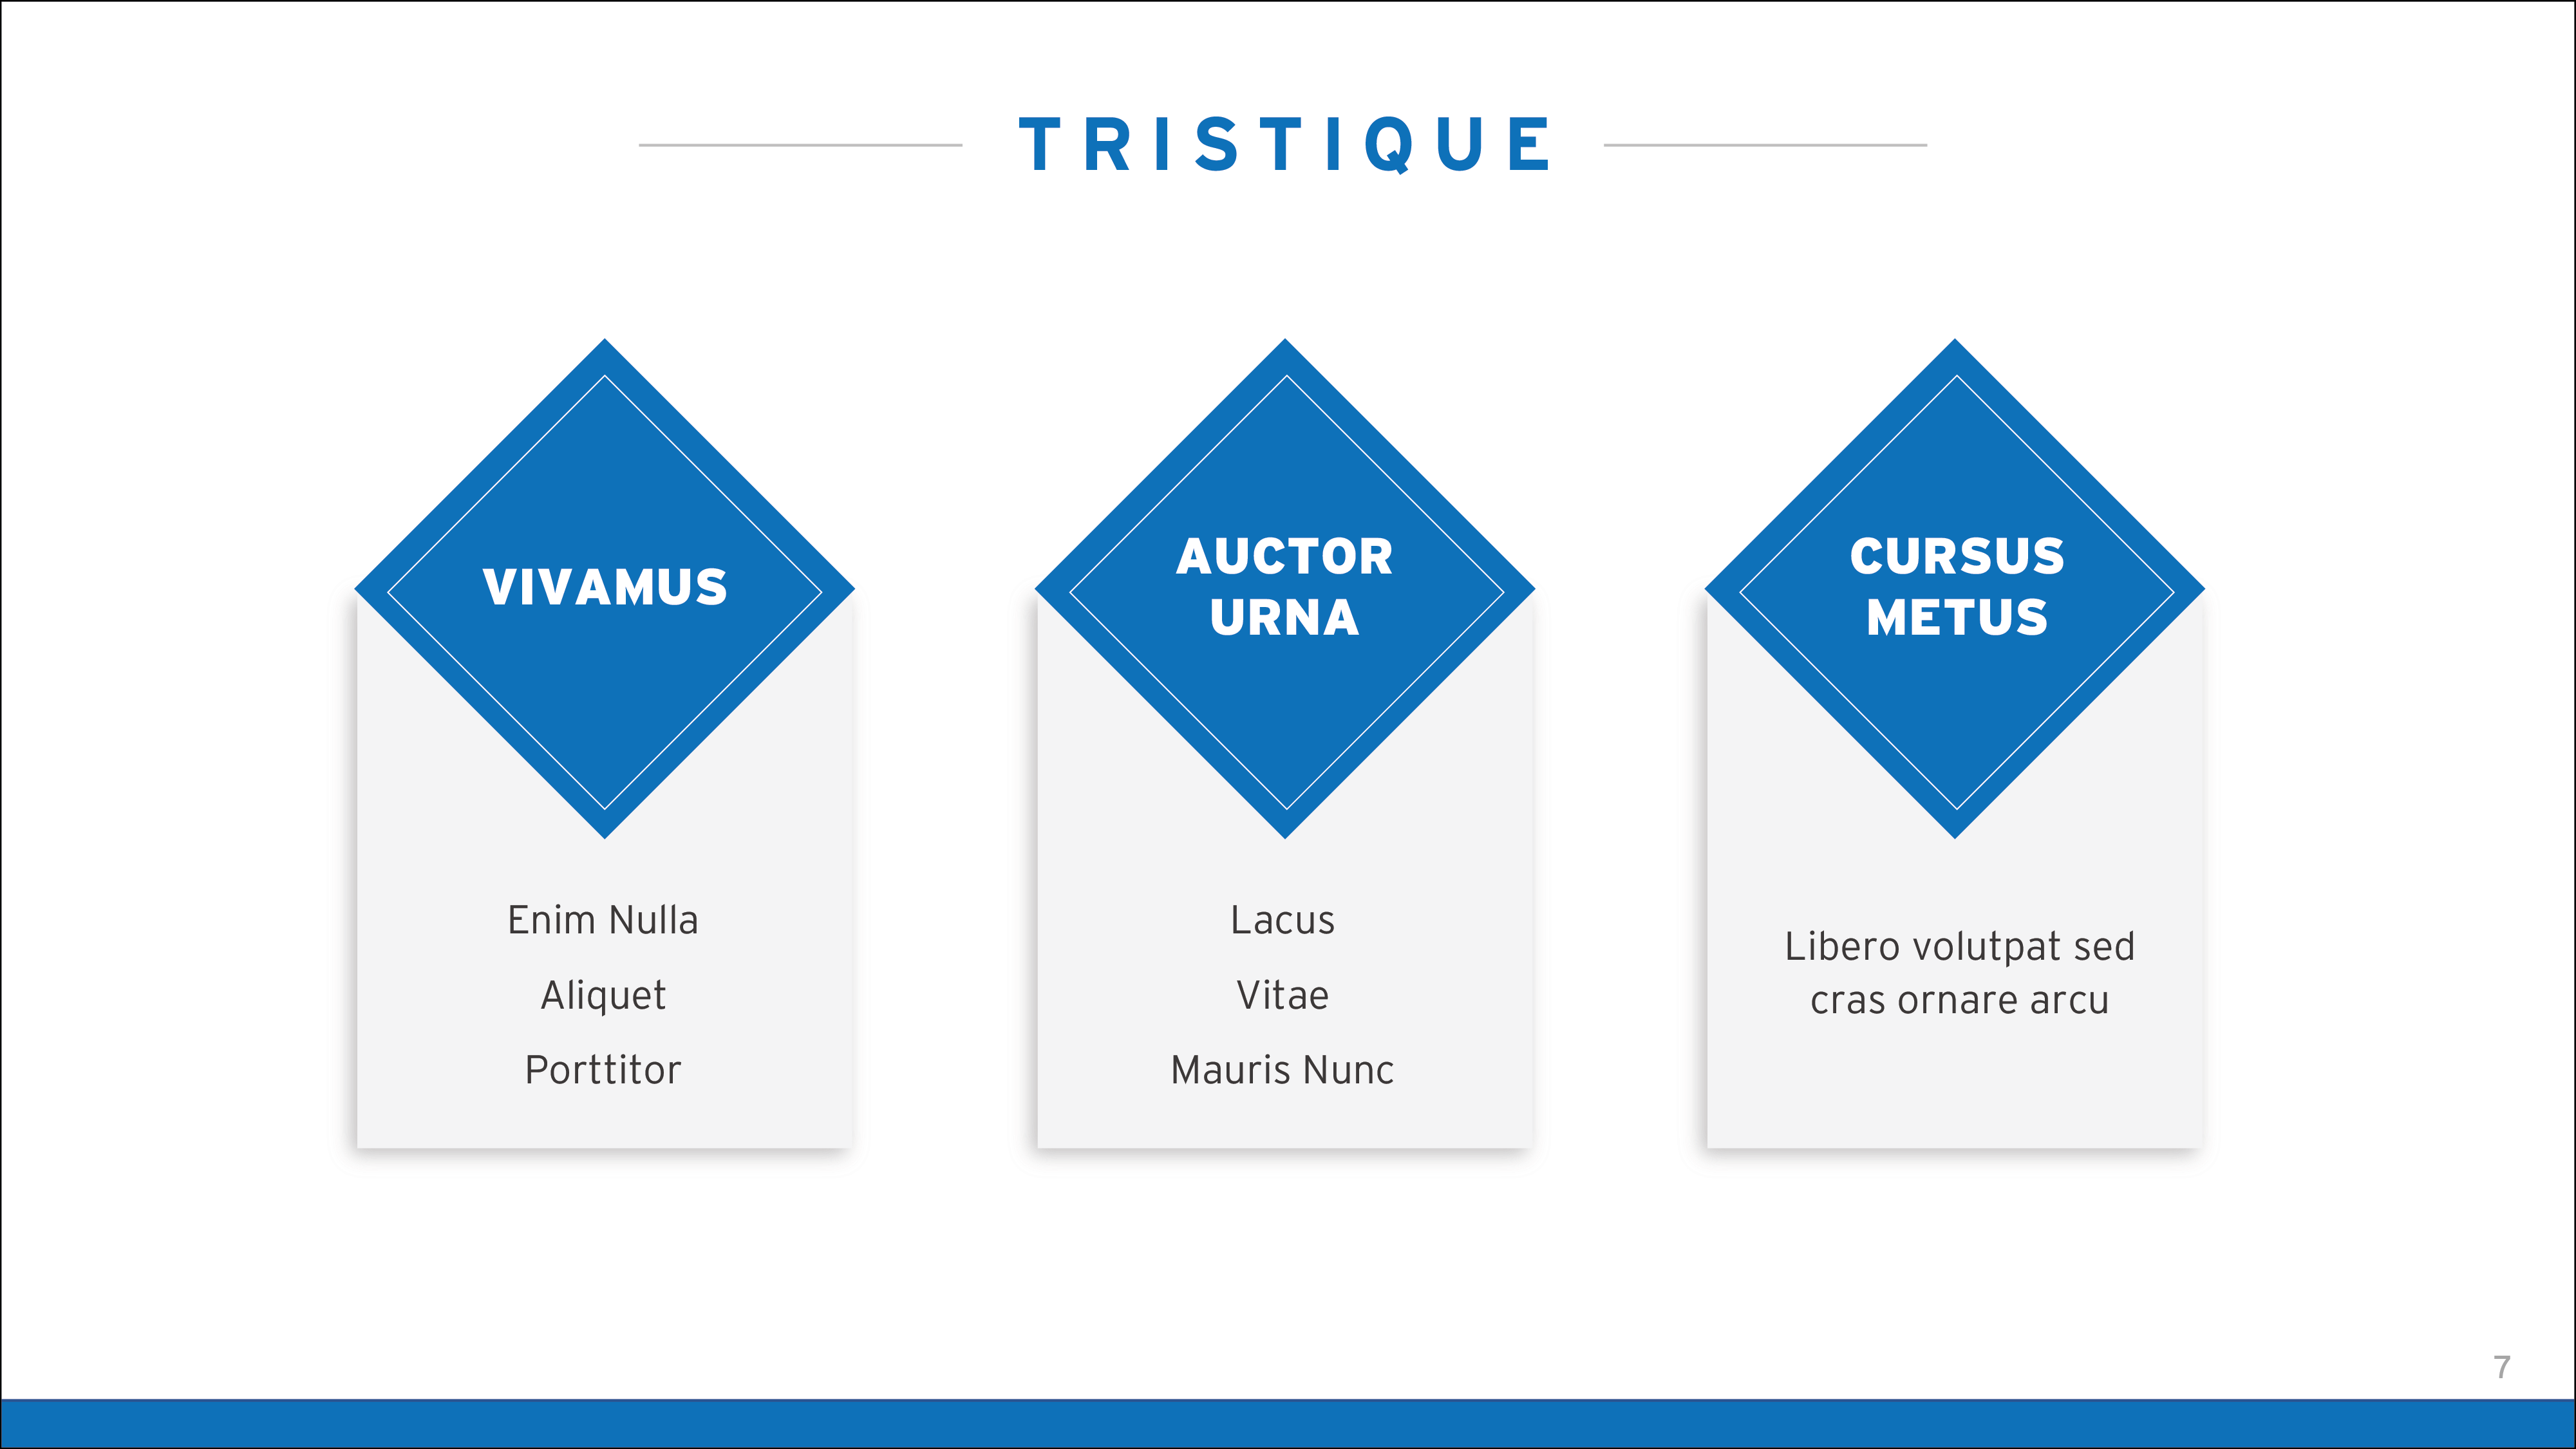
Blue
︎︎︎National JournalDesigned a fully editable powerpoint presentation from scratch for company V.
This presentation has been edited heavily to showcase publicly.


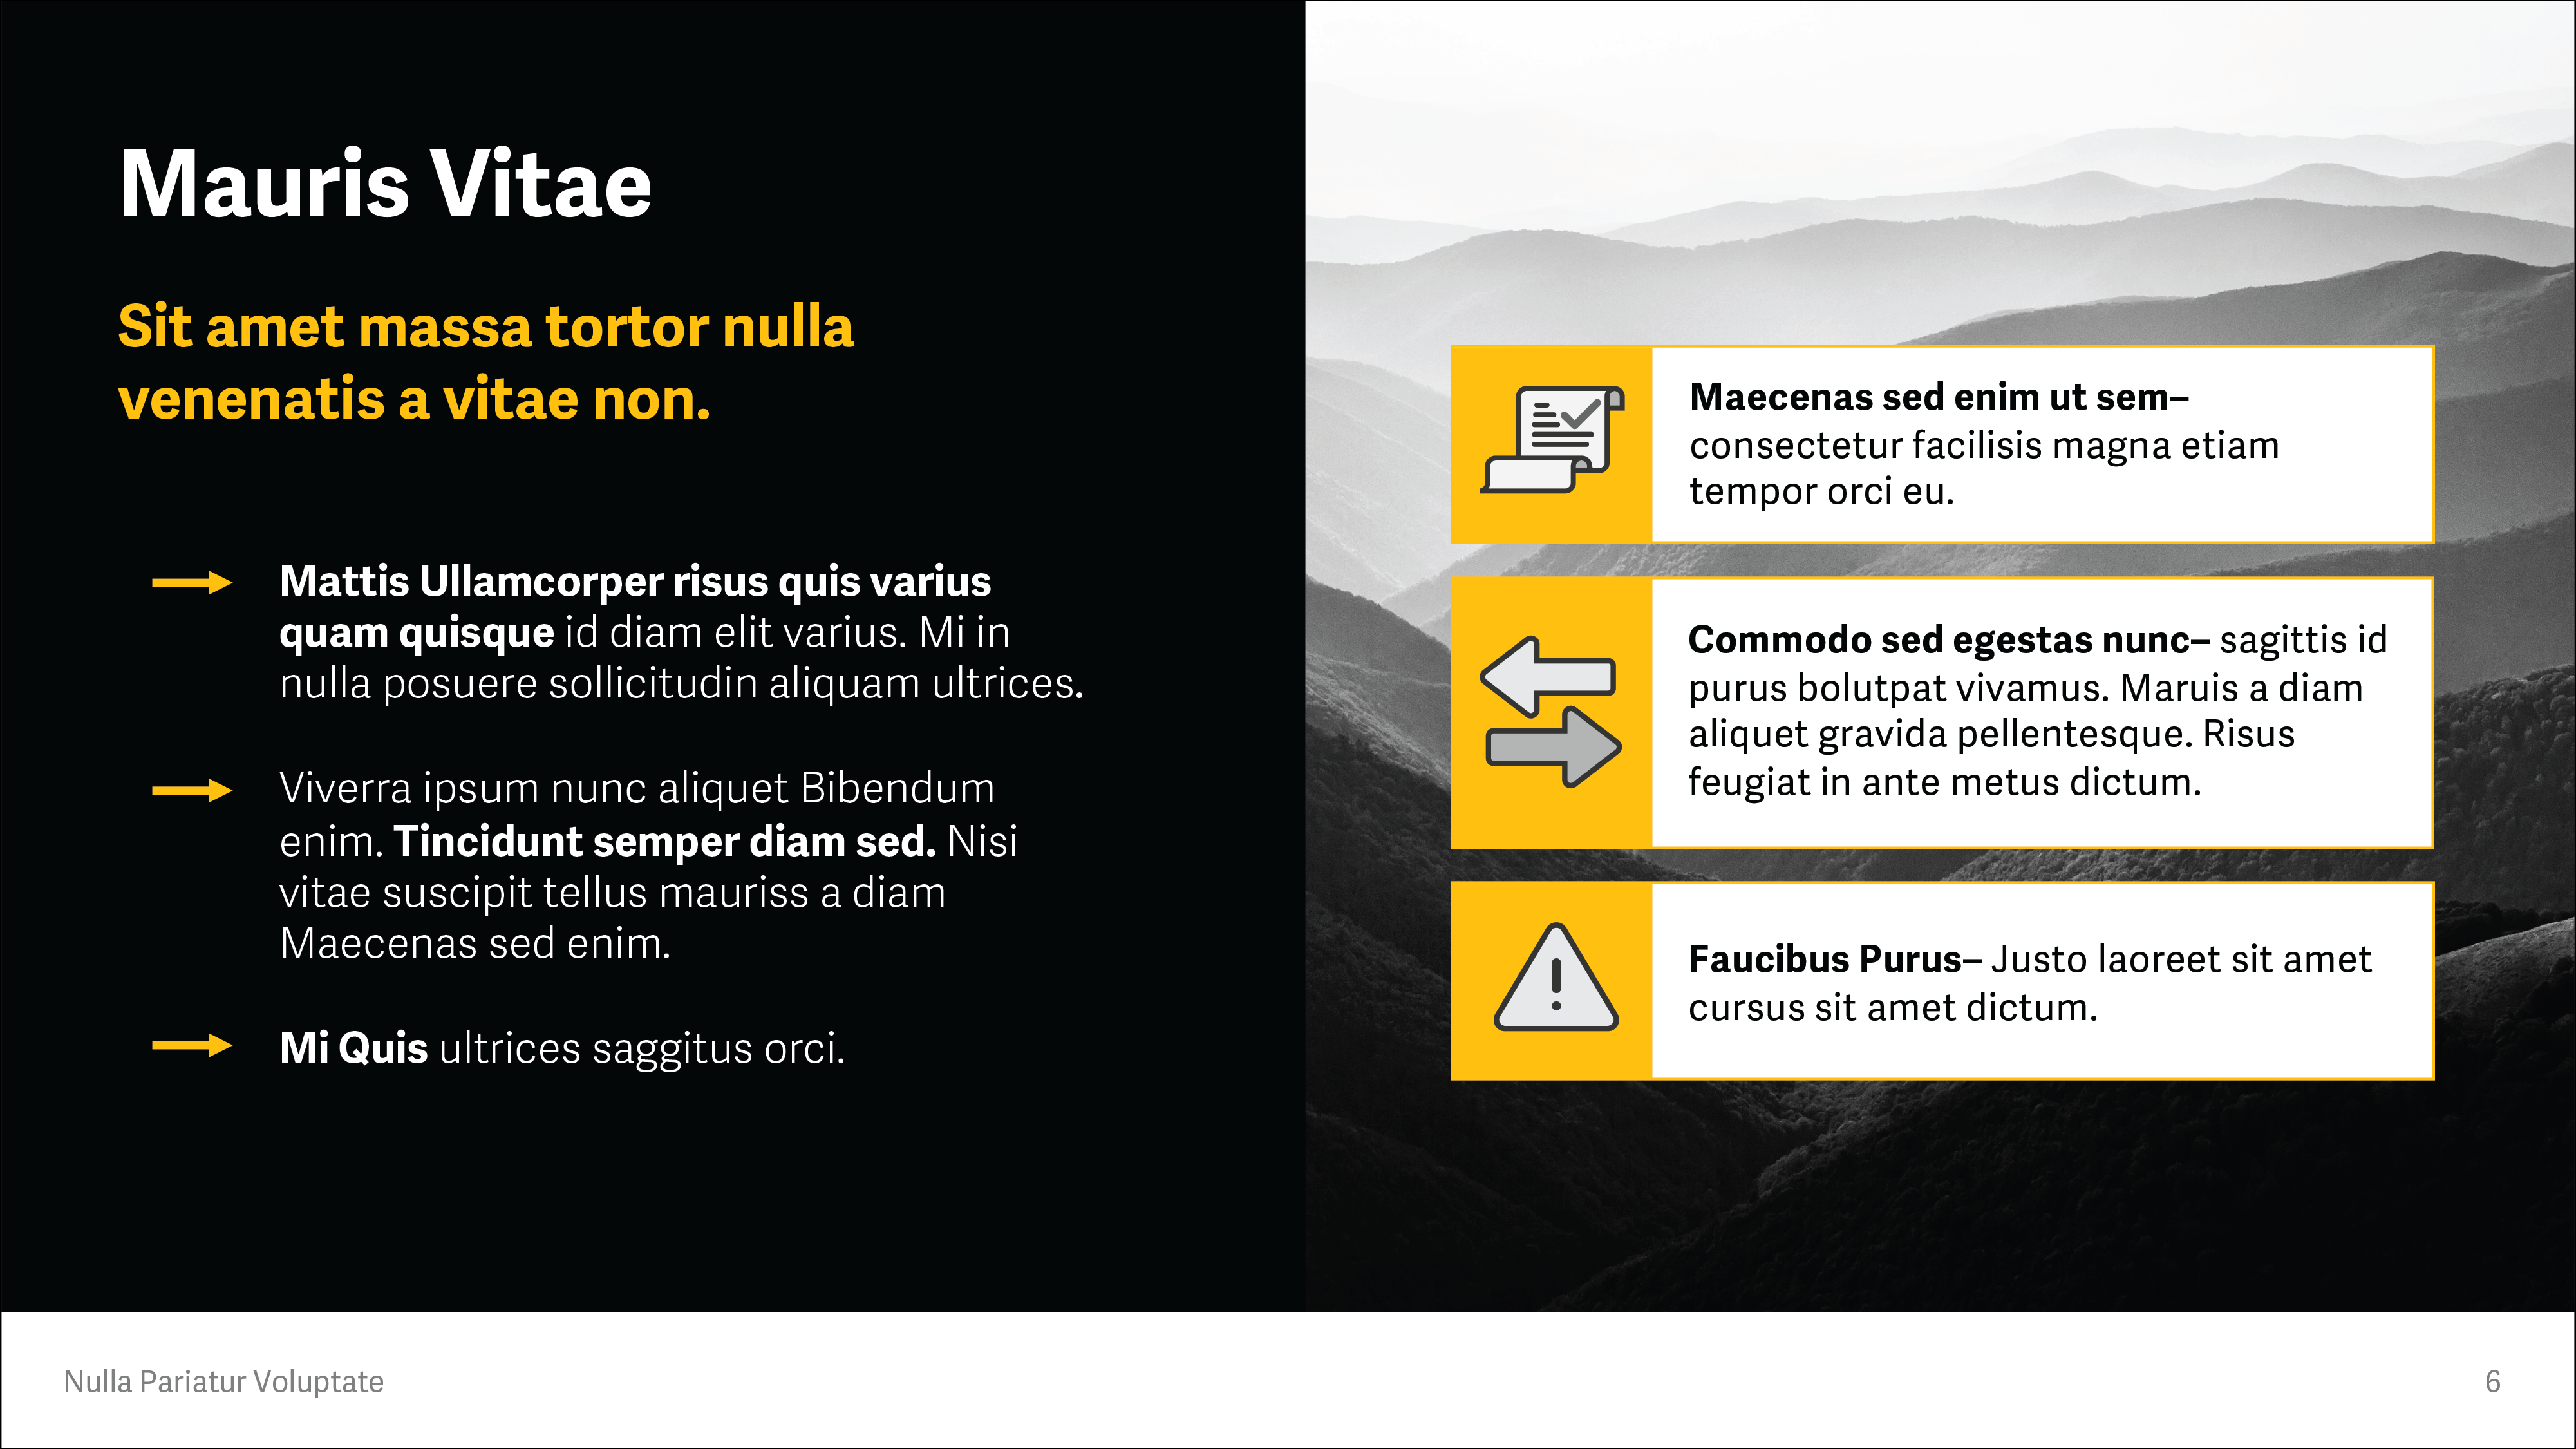
Tradeshow Guide
︎︎︎GartnerAn infographic that shows the “what to do” and “what not to do” for a tradeshow/exhibition booth. Collaborated with both the writer, and the analyst to ensure that the visuals stayed true to the text and aided the flow of the infographic.

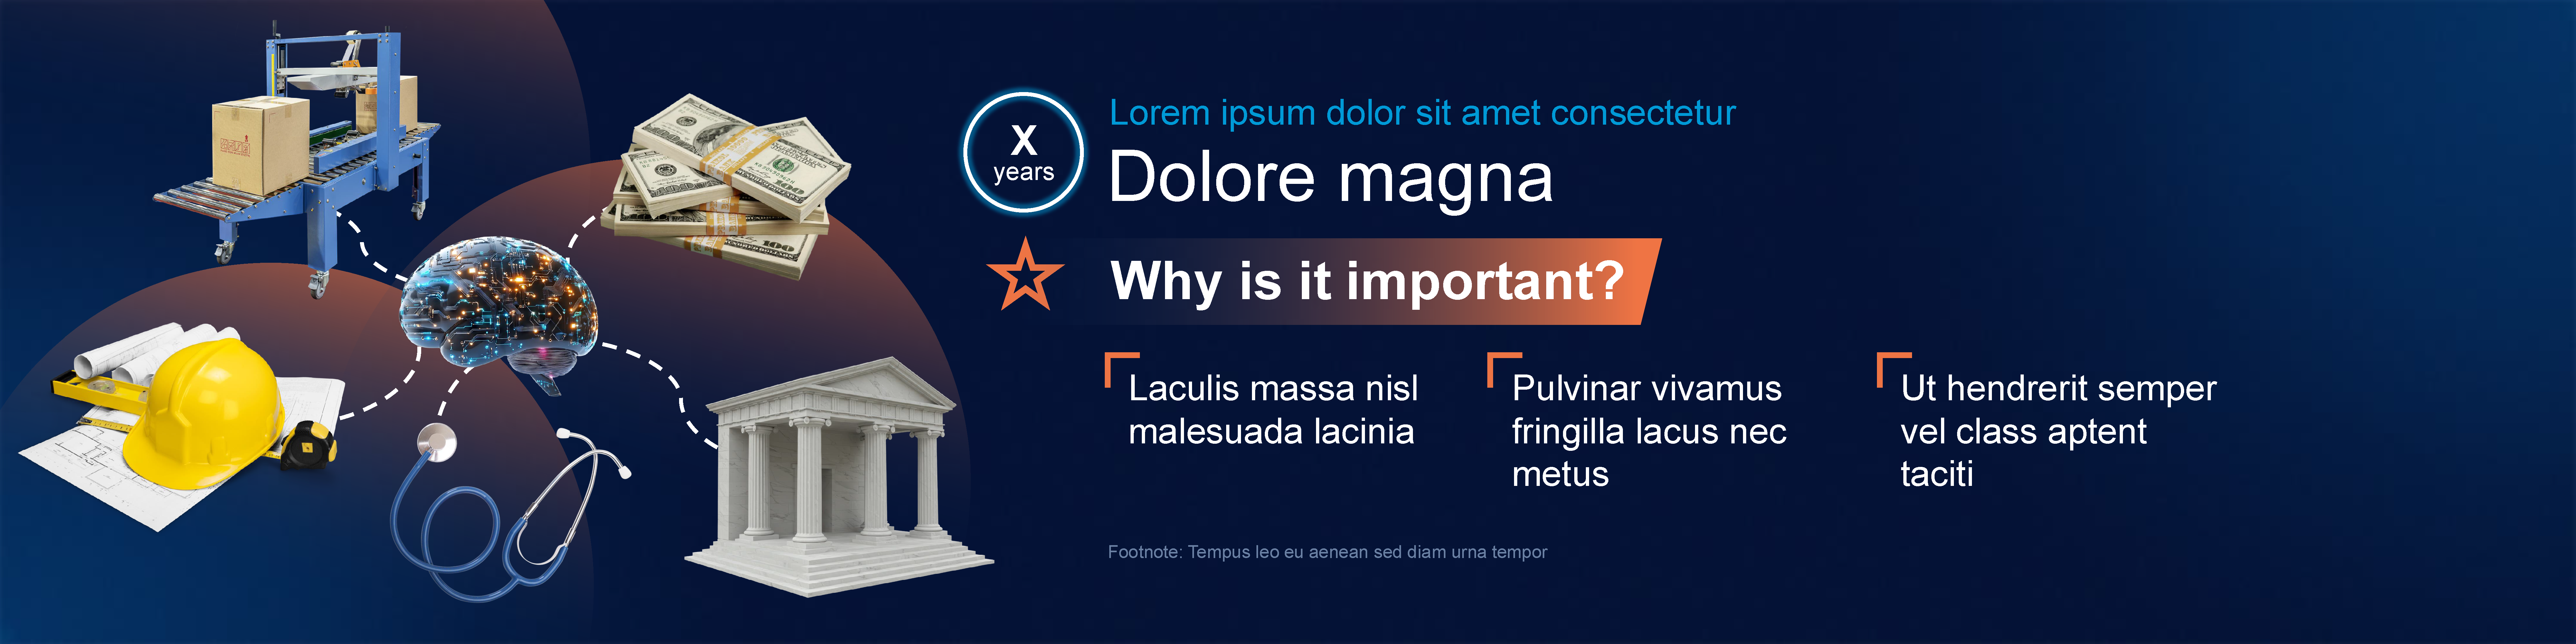
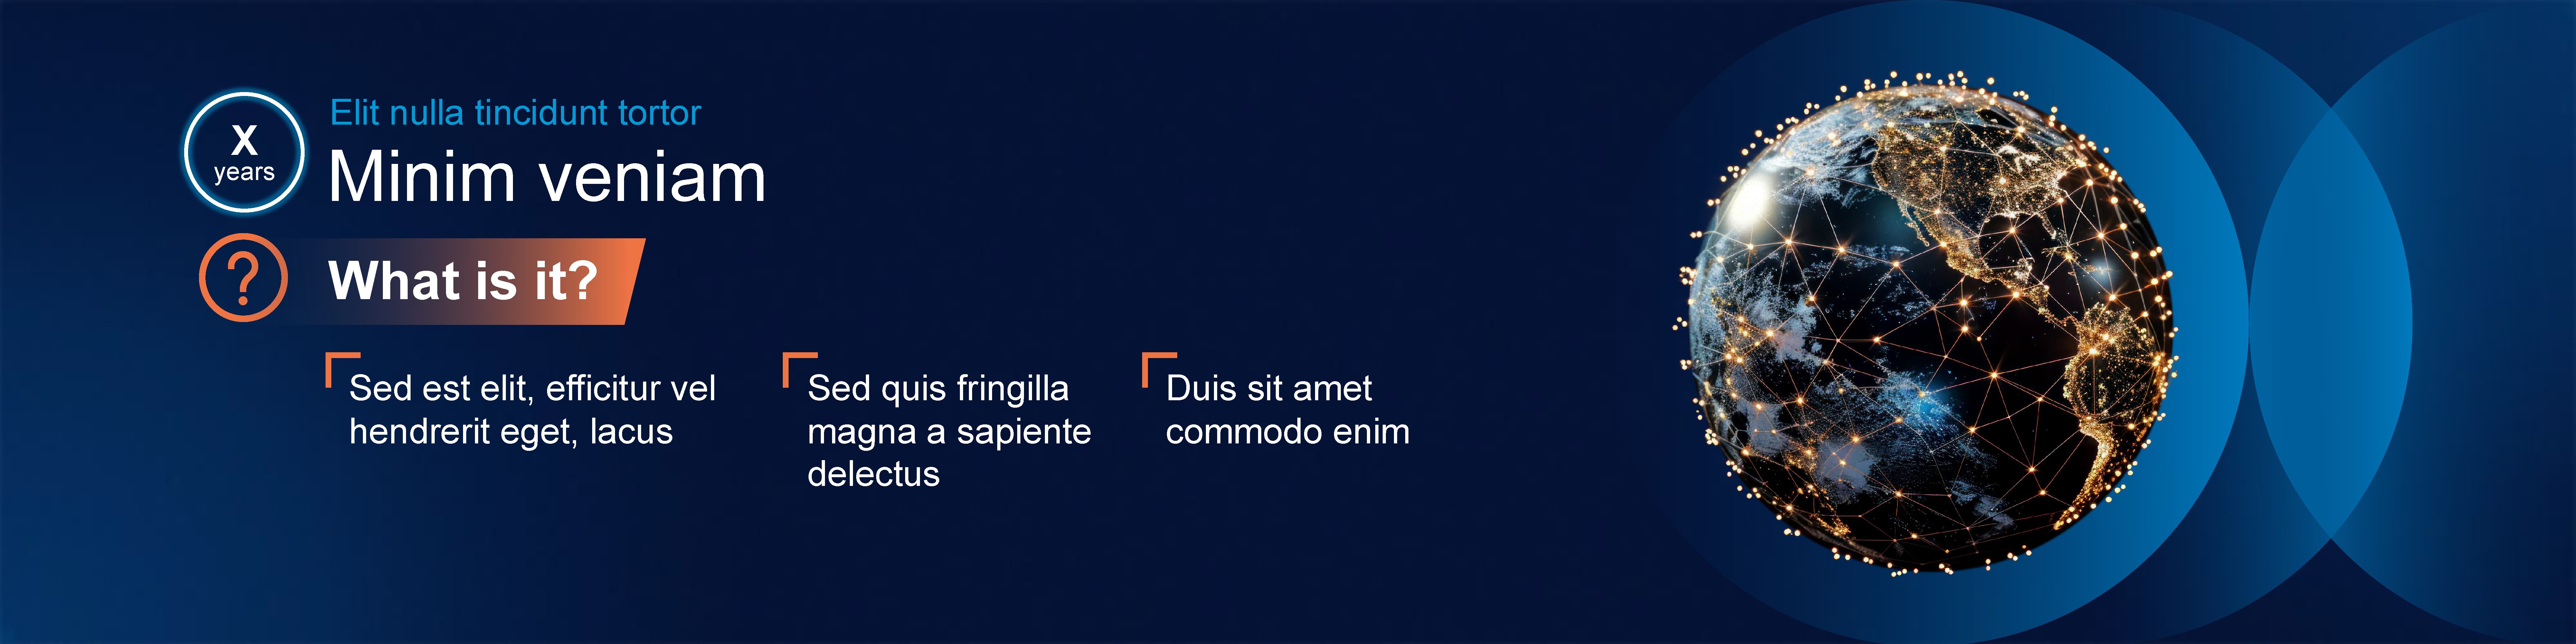
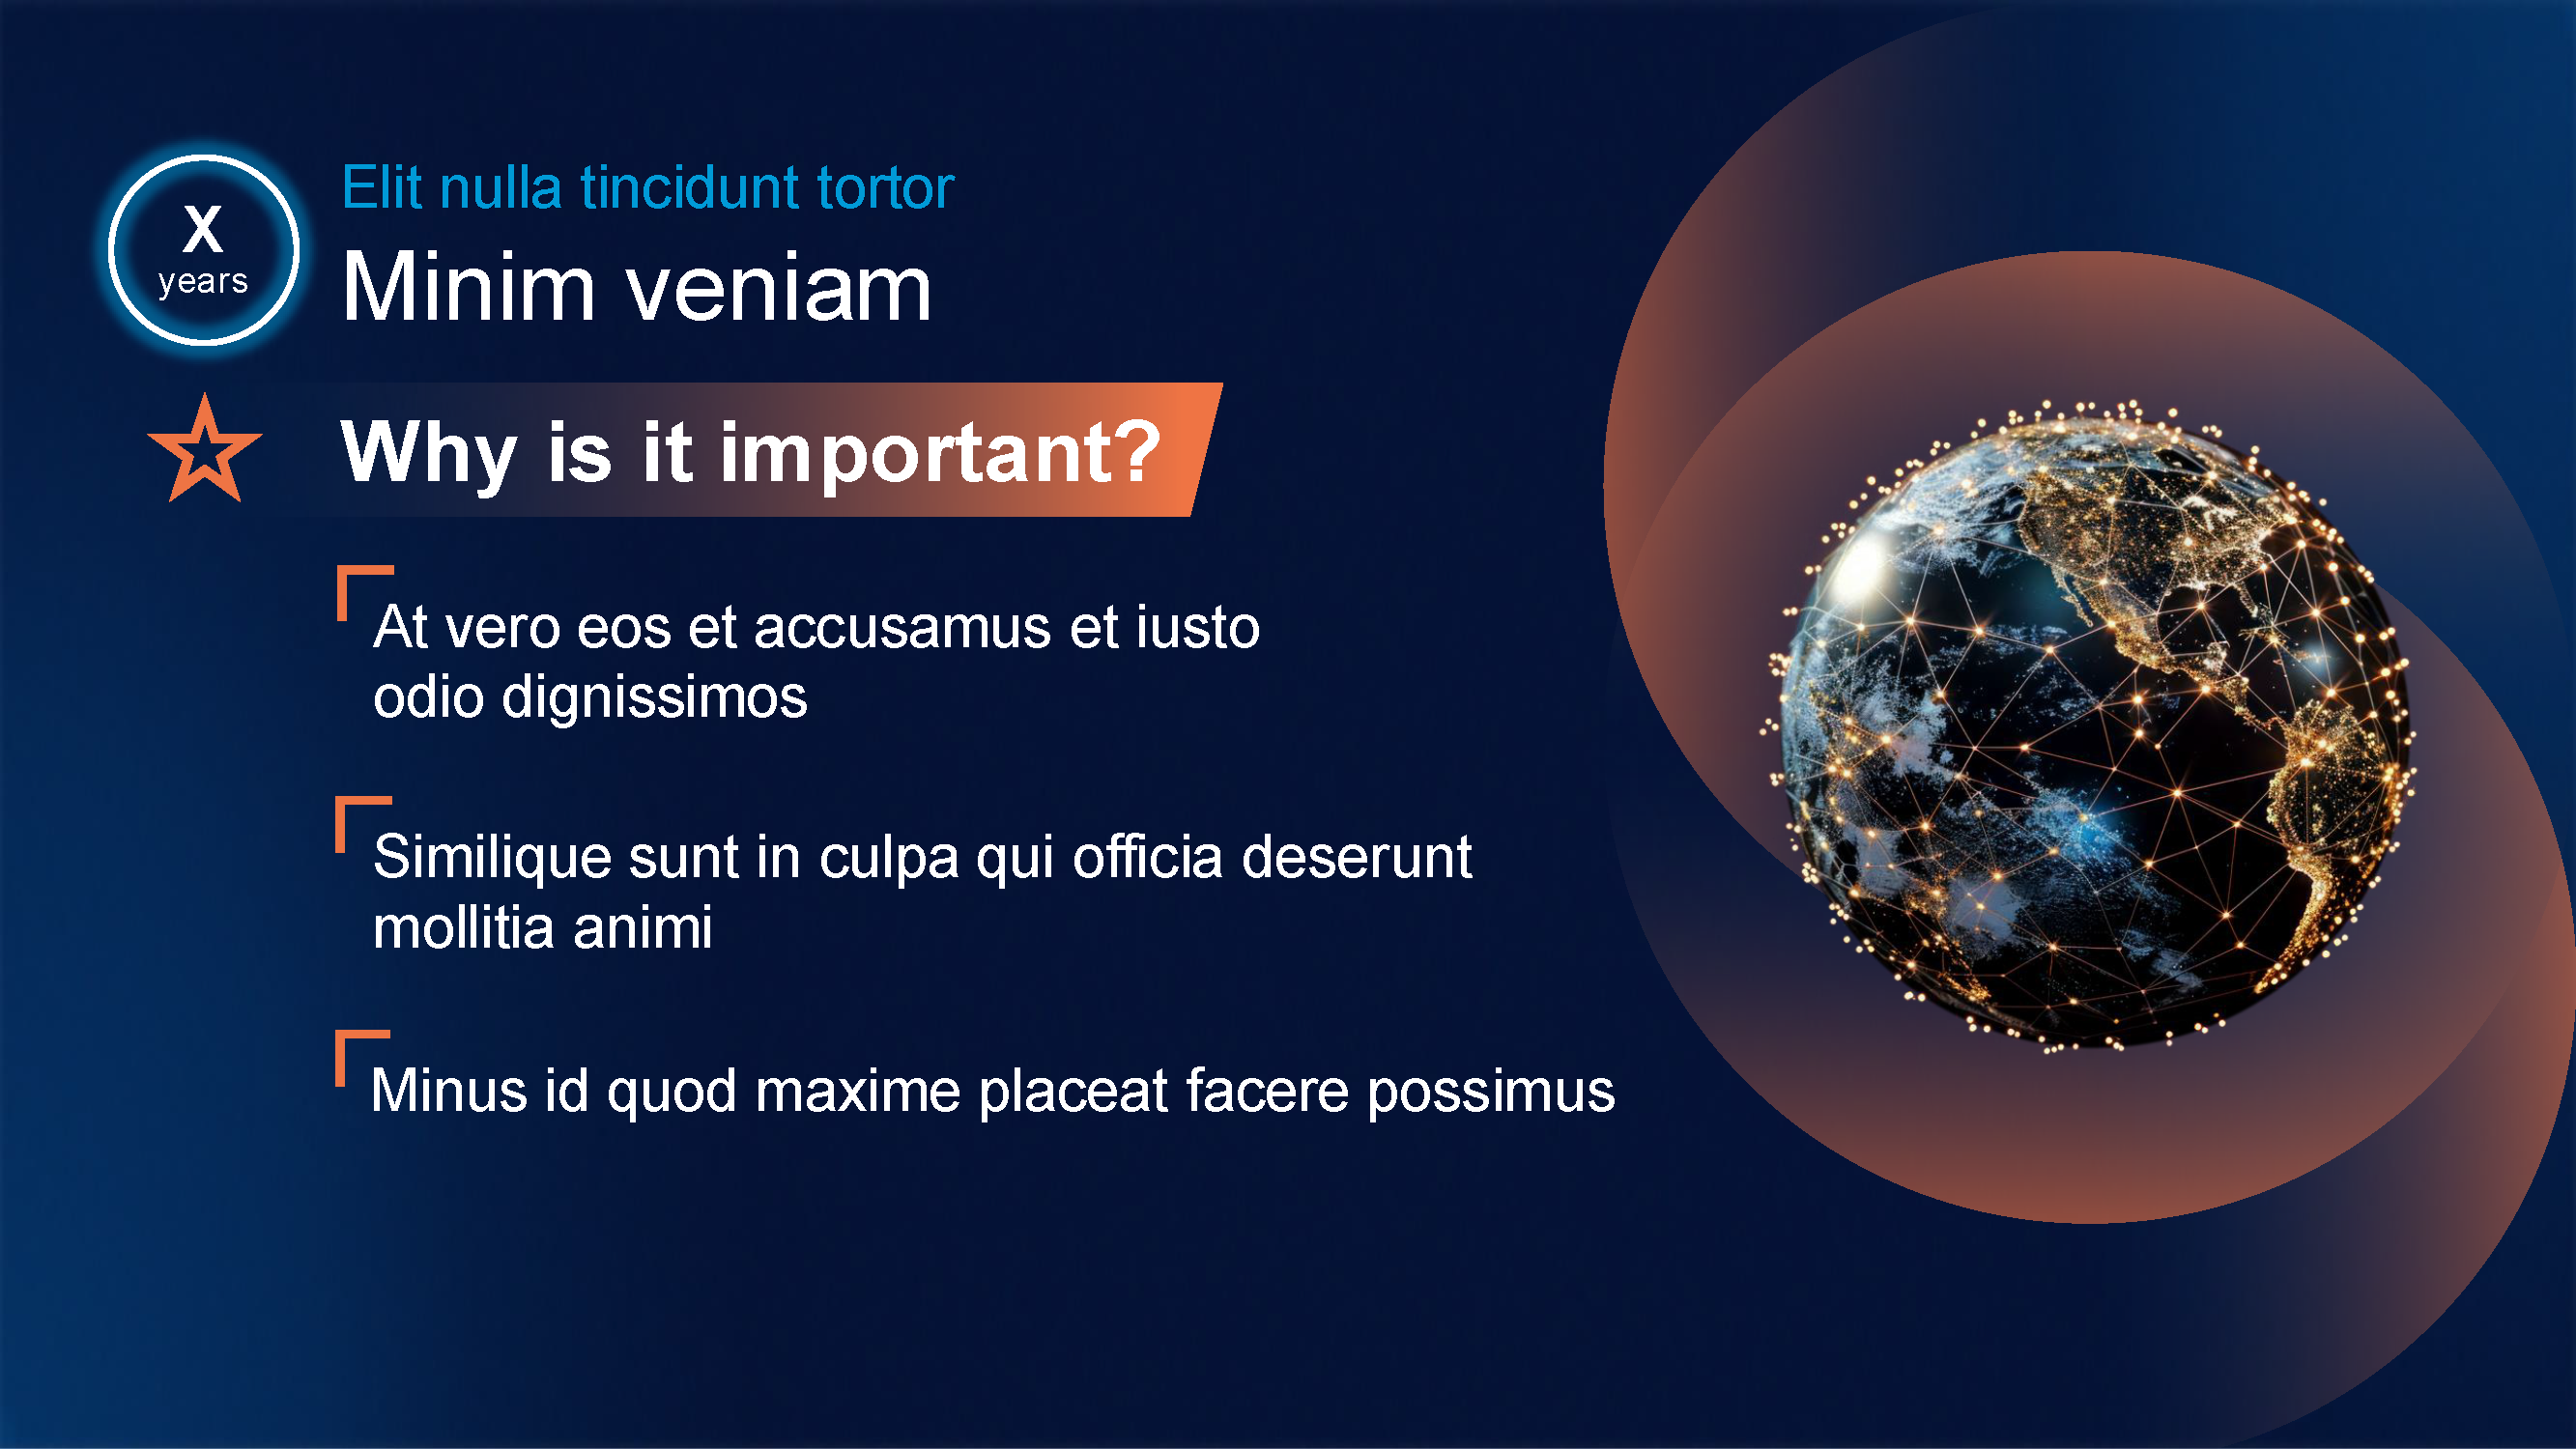
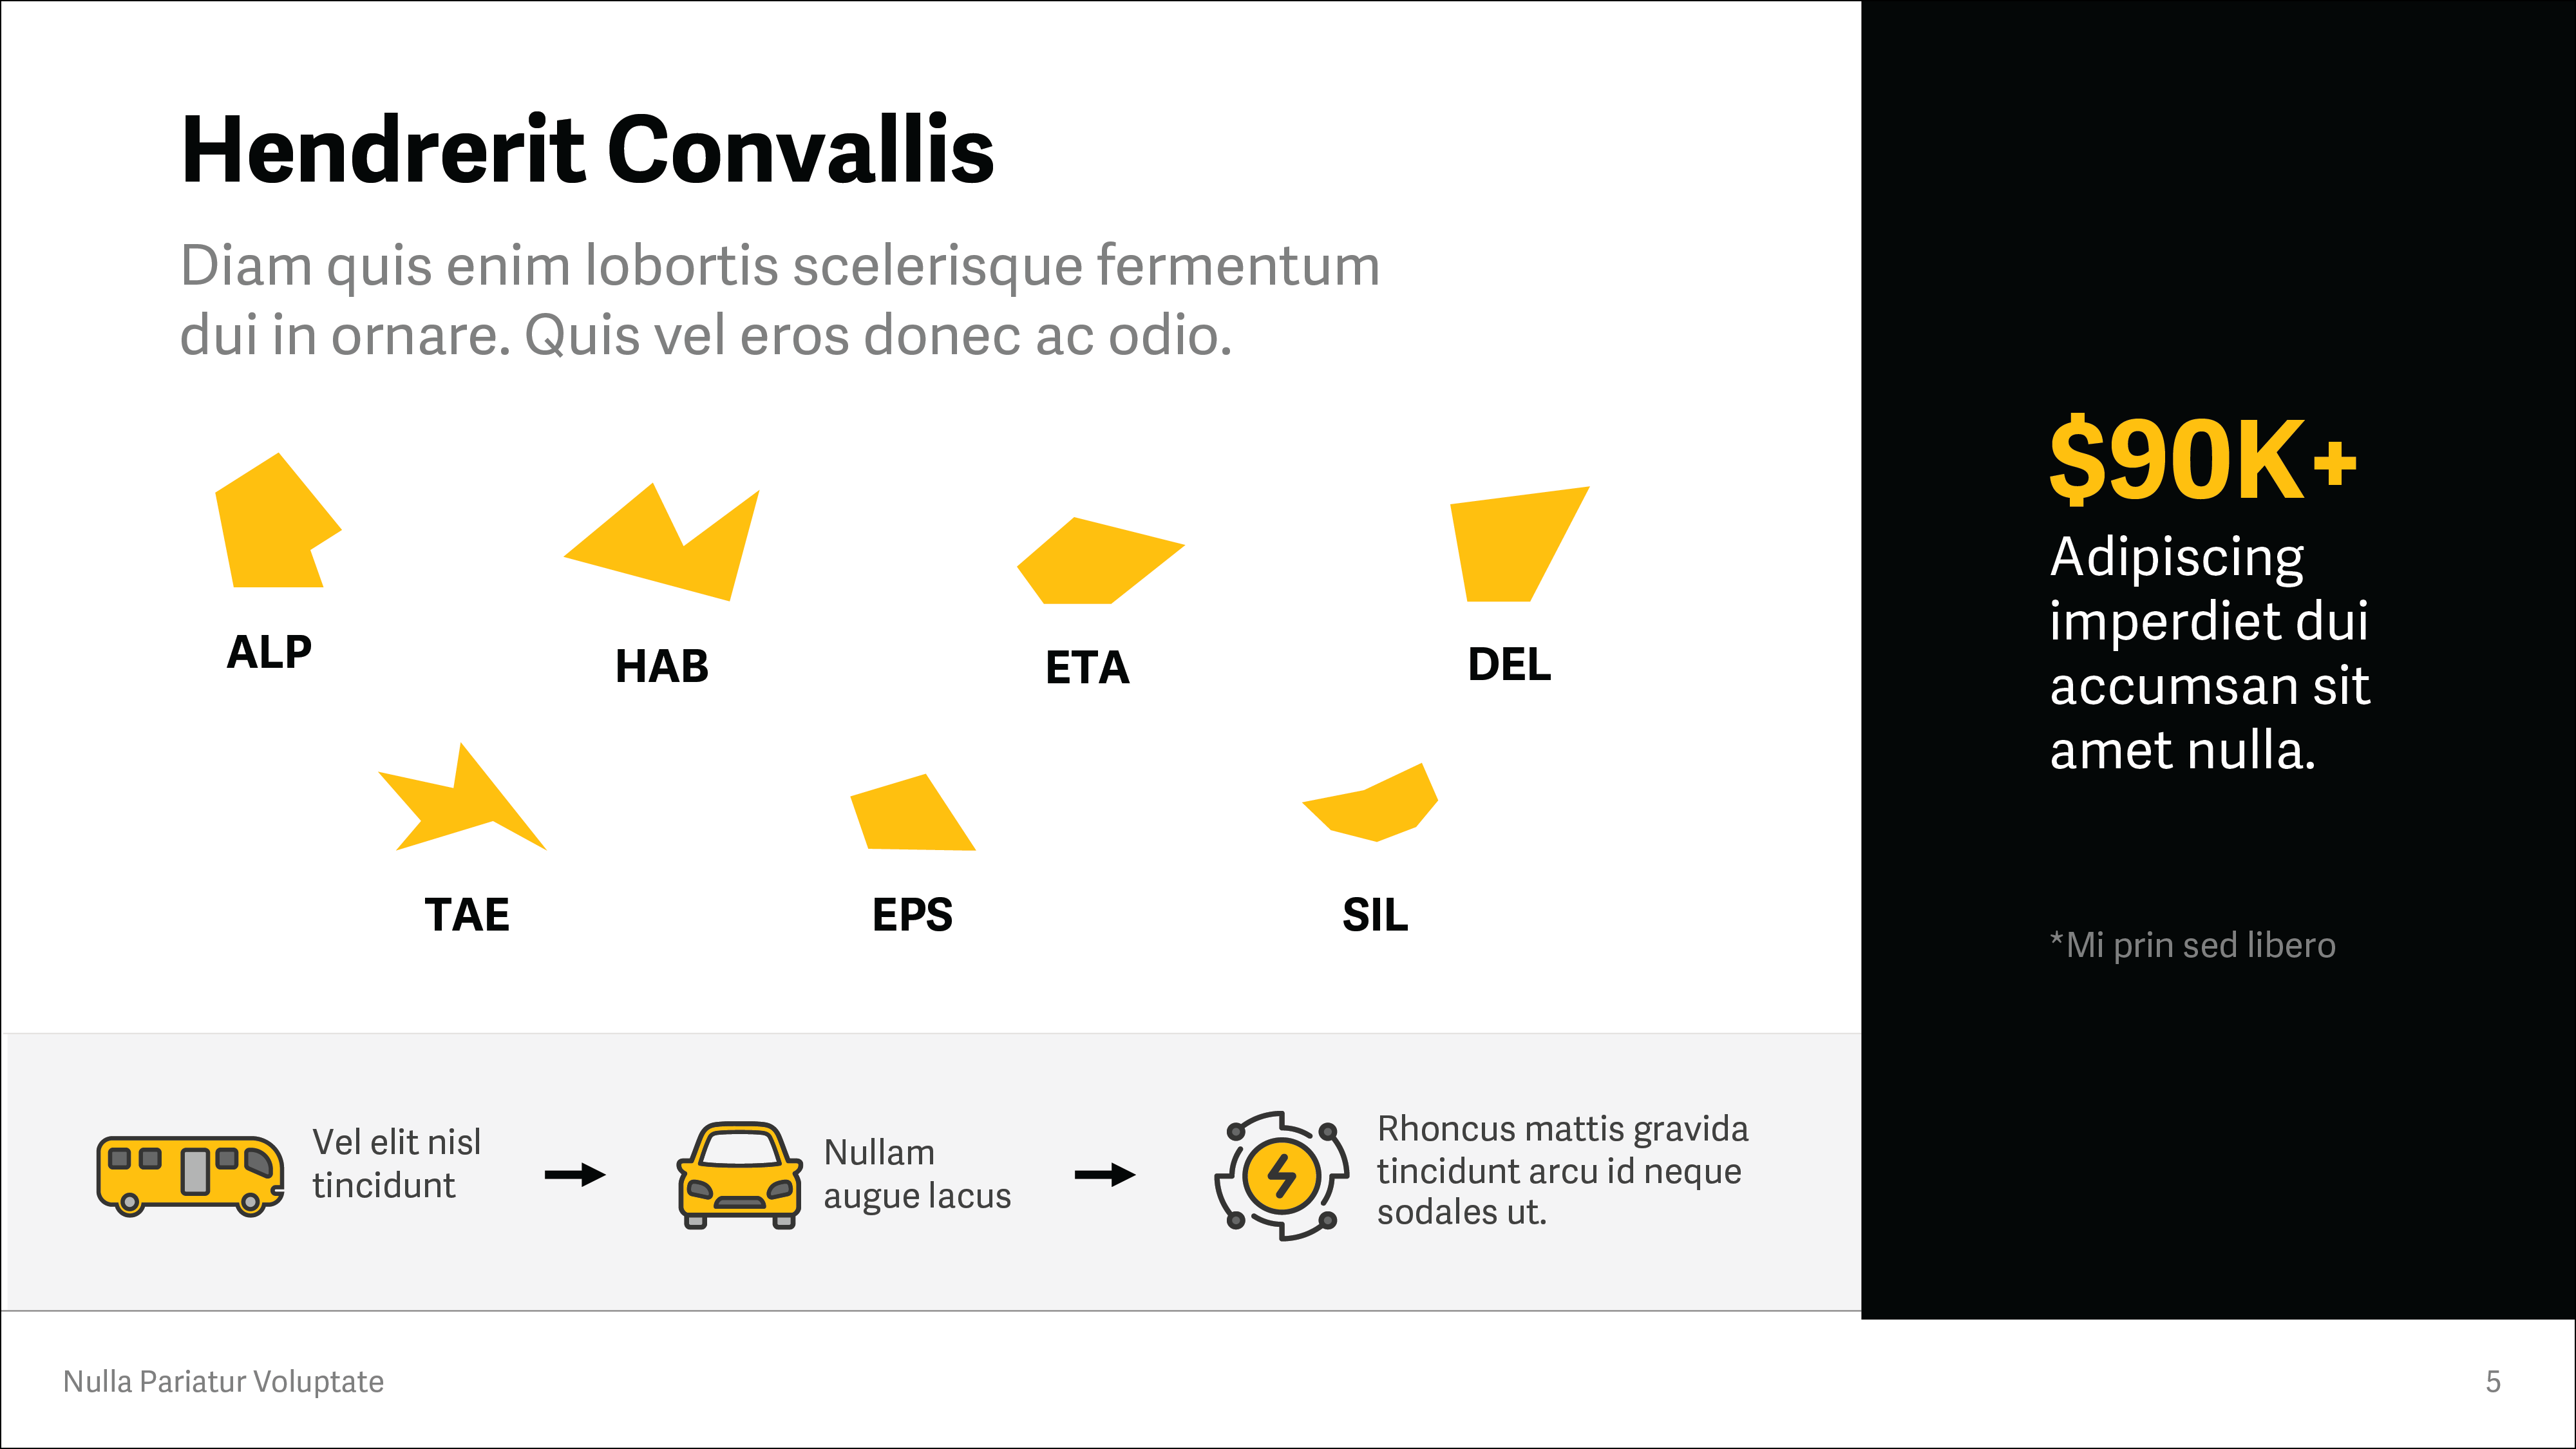
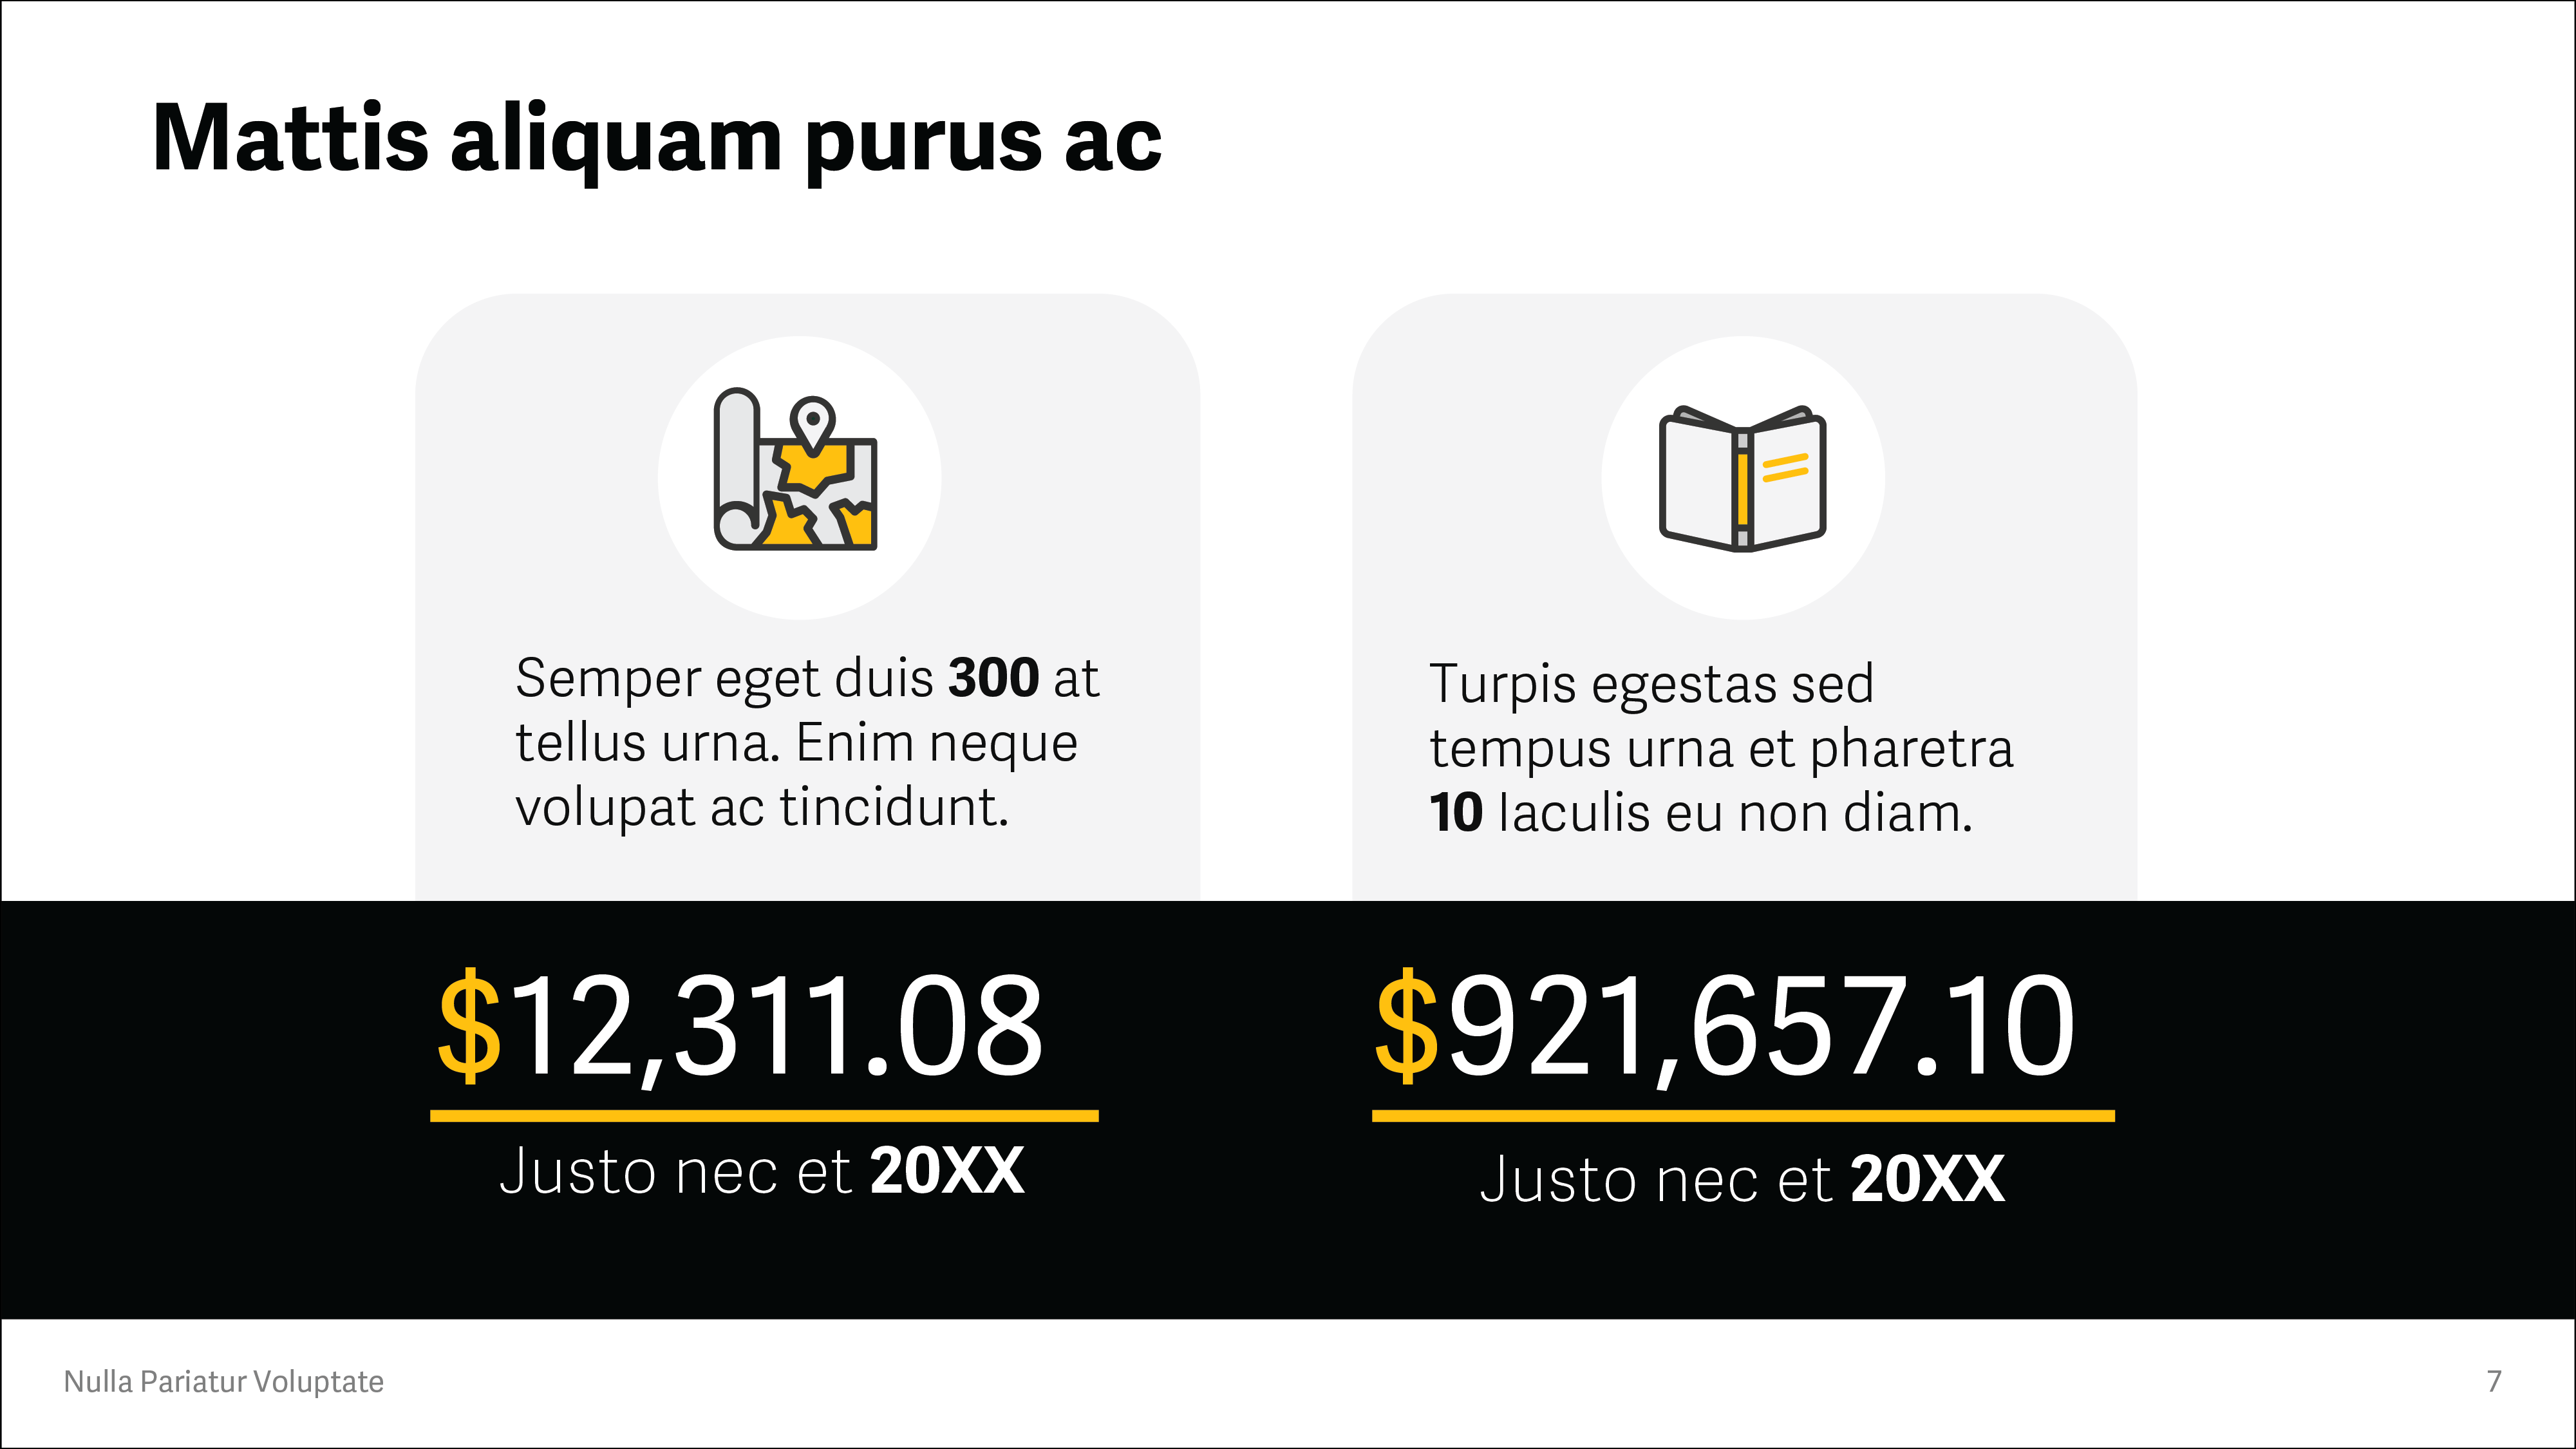
IT Roadmap
︎︎︎GartnerA roadmap infographic that focuses more on the data with specific callouts. The orange highlight is bold and organizes each section.

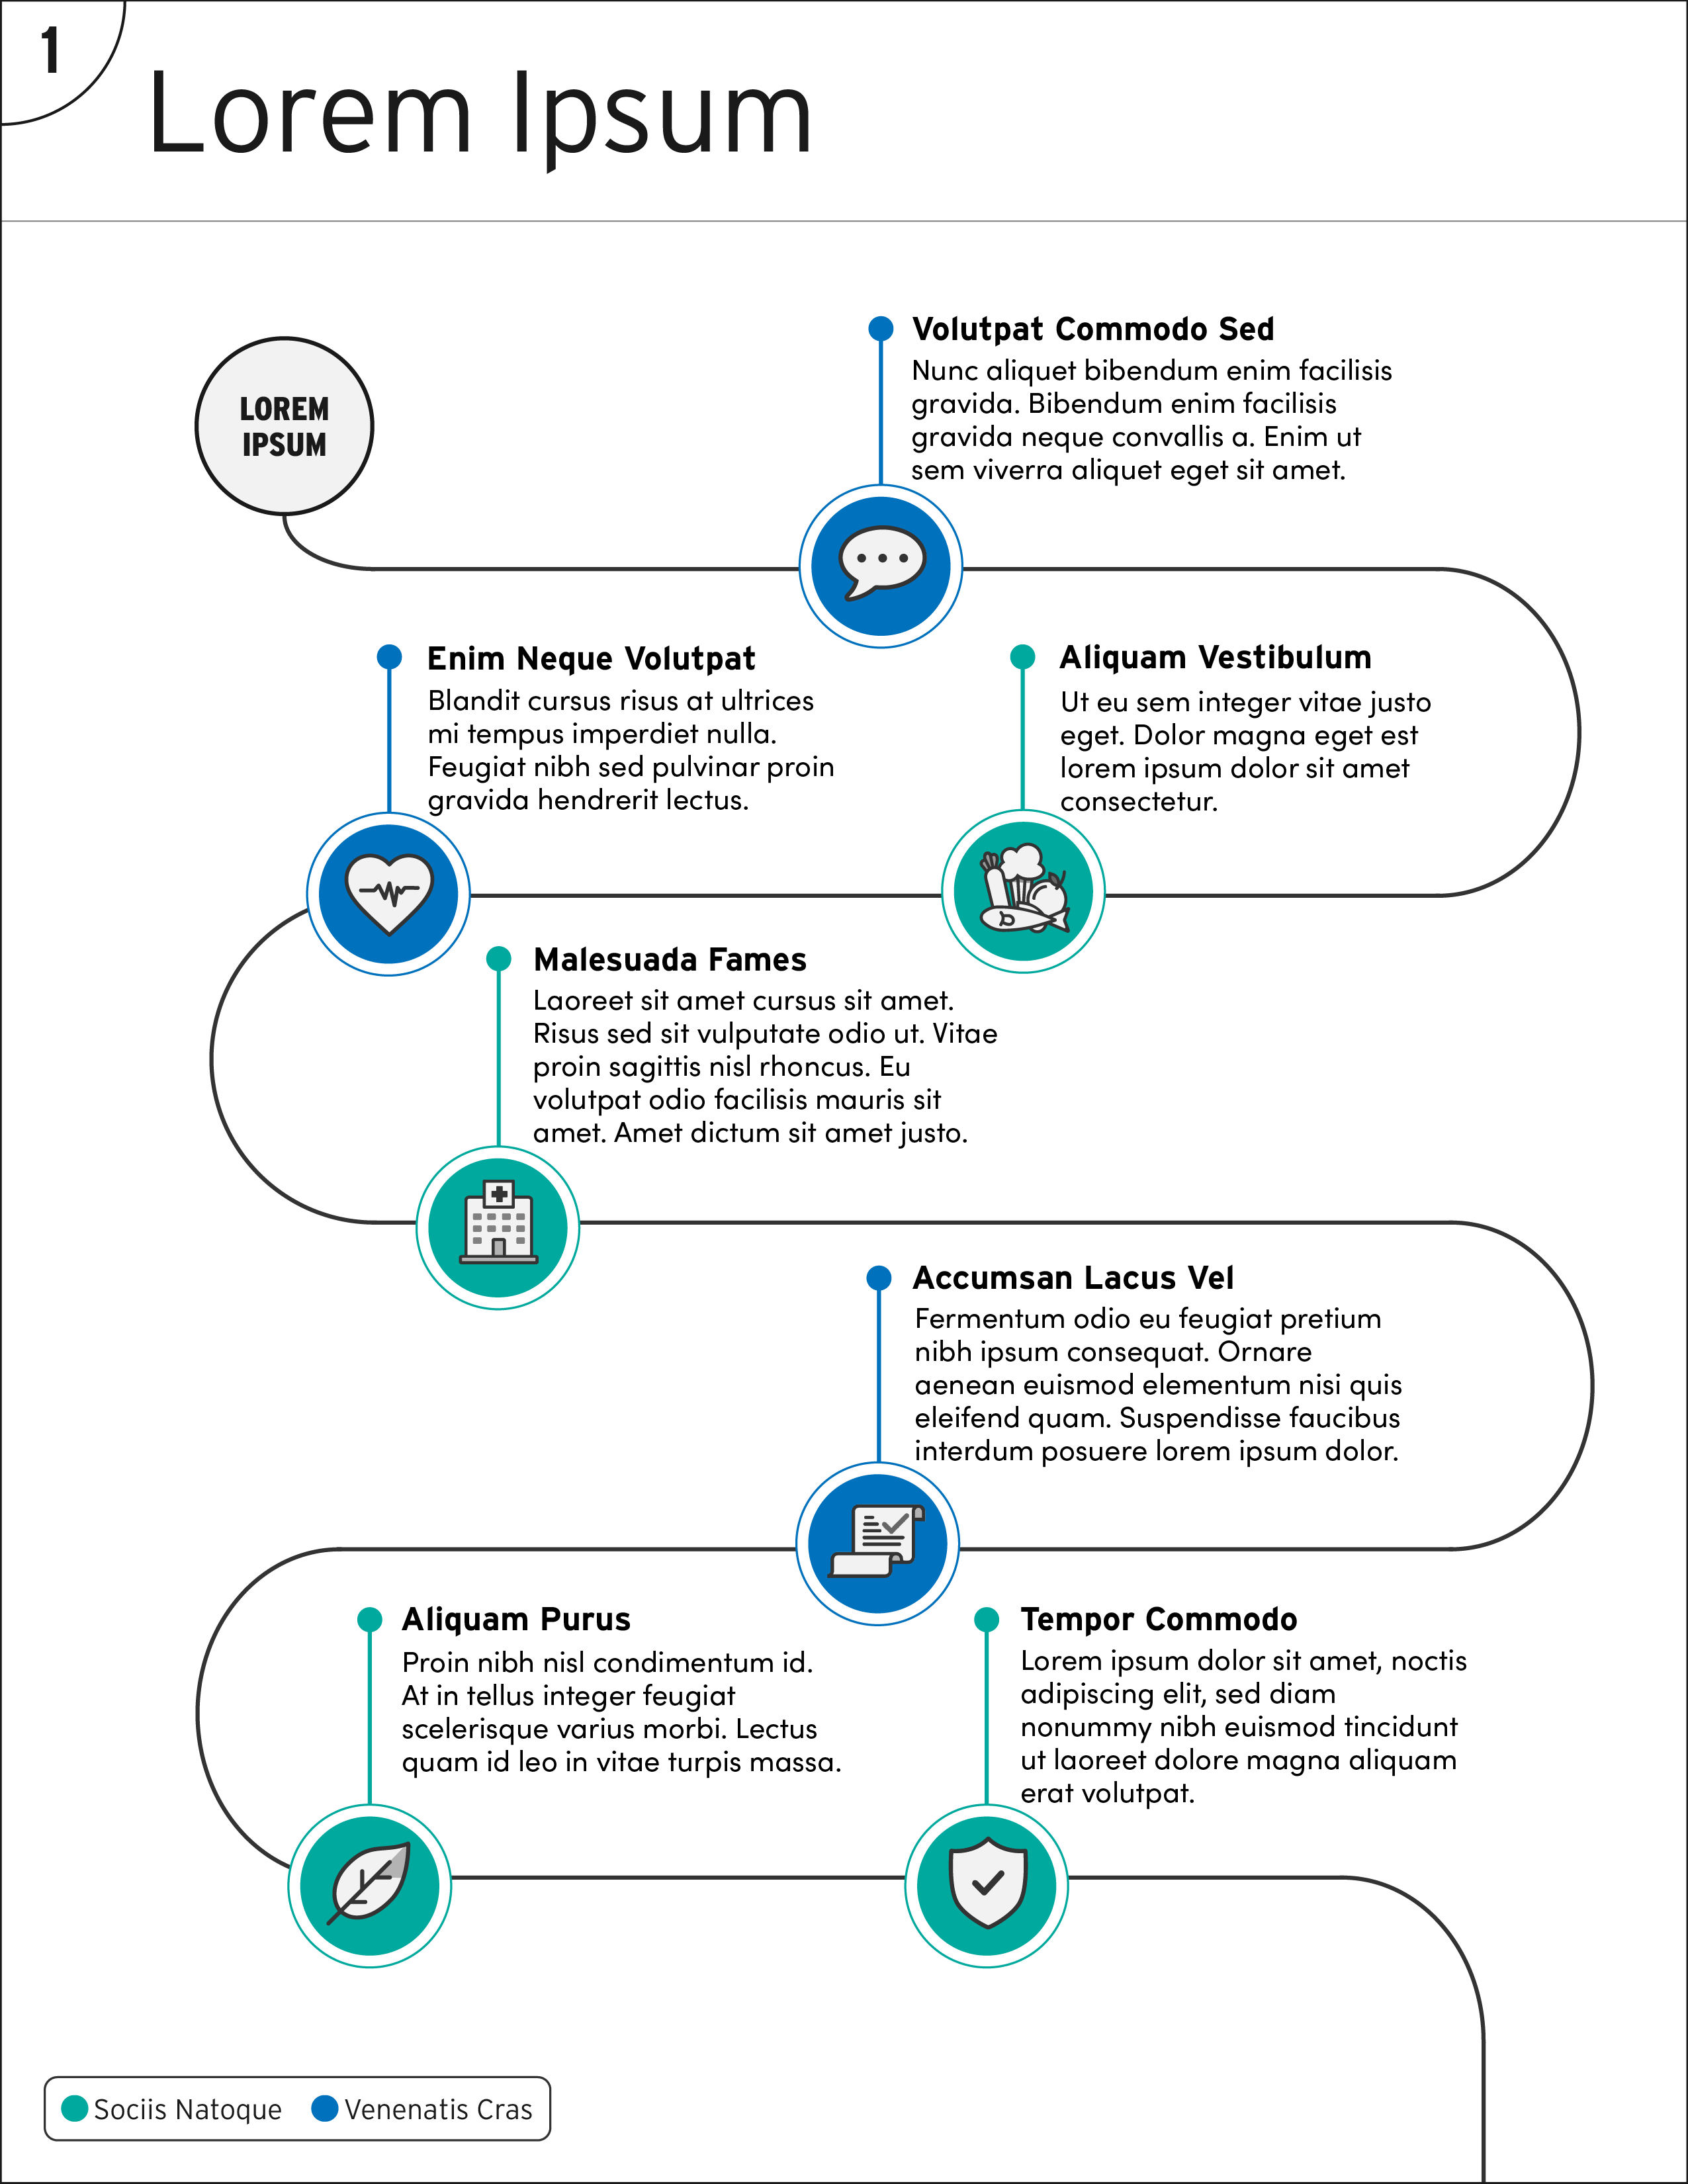
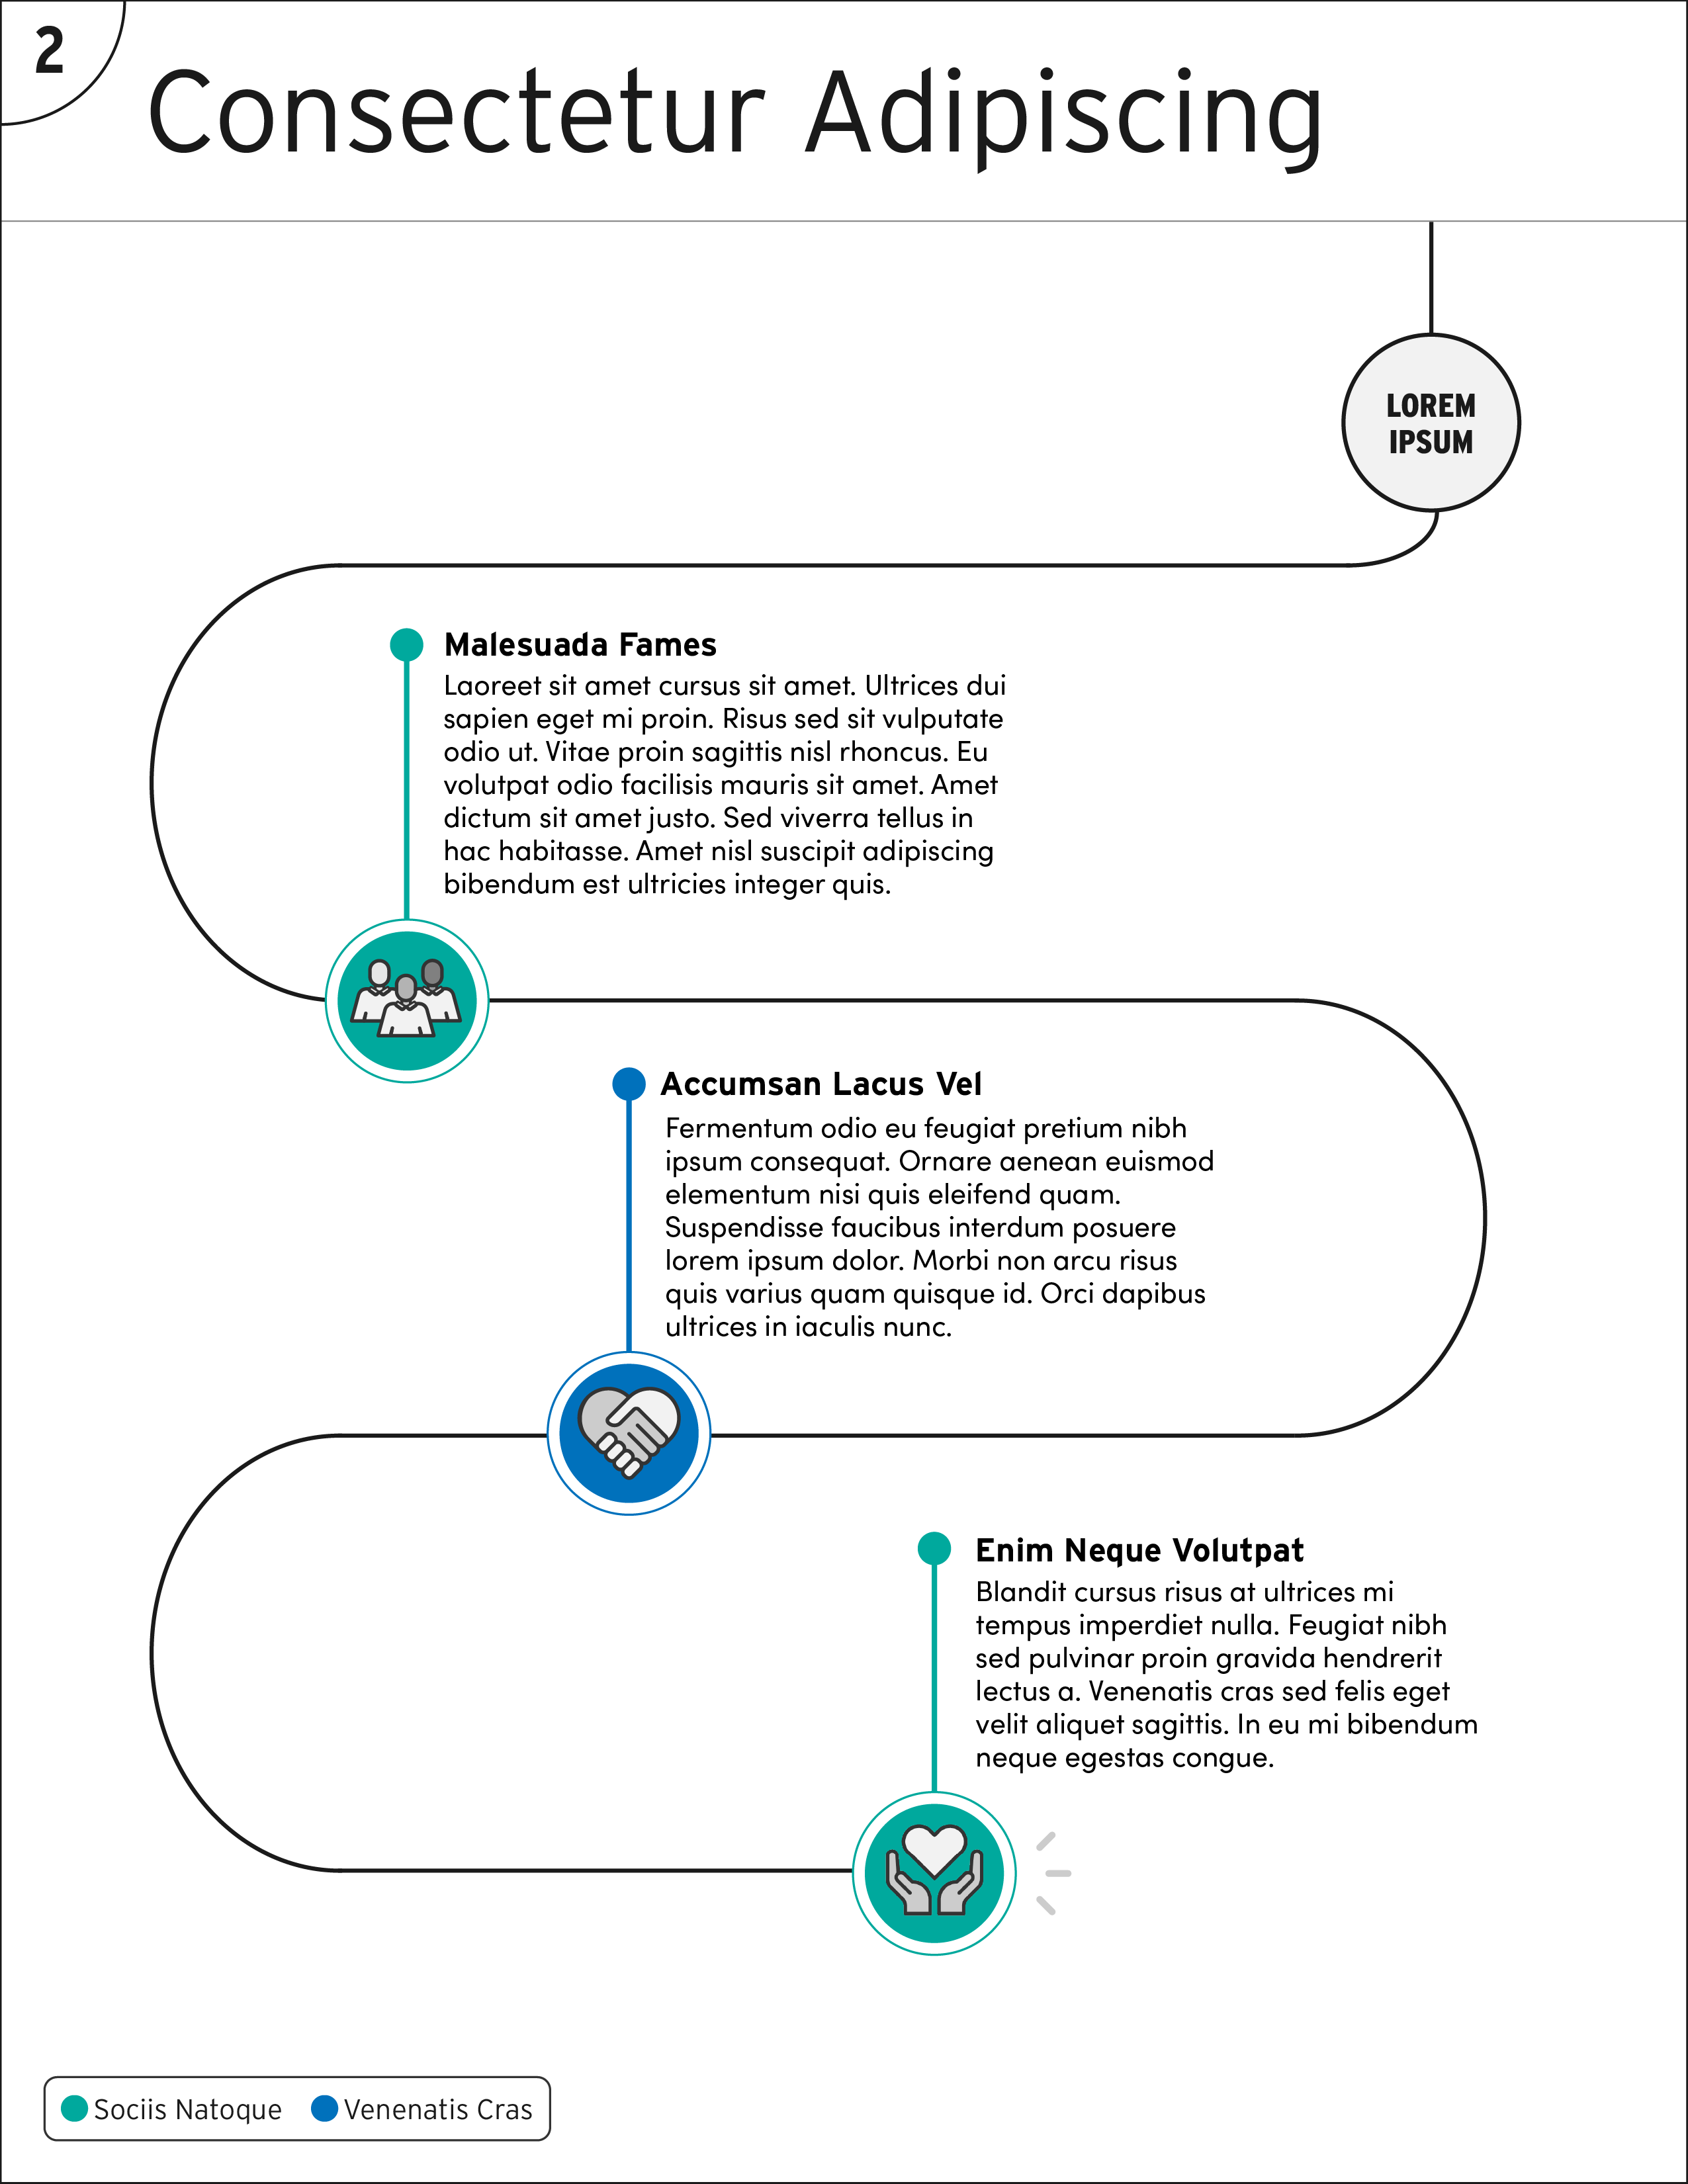
Timeline (2 pages)
︎︎︎National JournalA two-pager timeline infographic that shows each significant point with a short description.
Organization Chart
︎︎︎National Journal
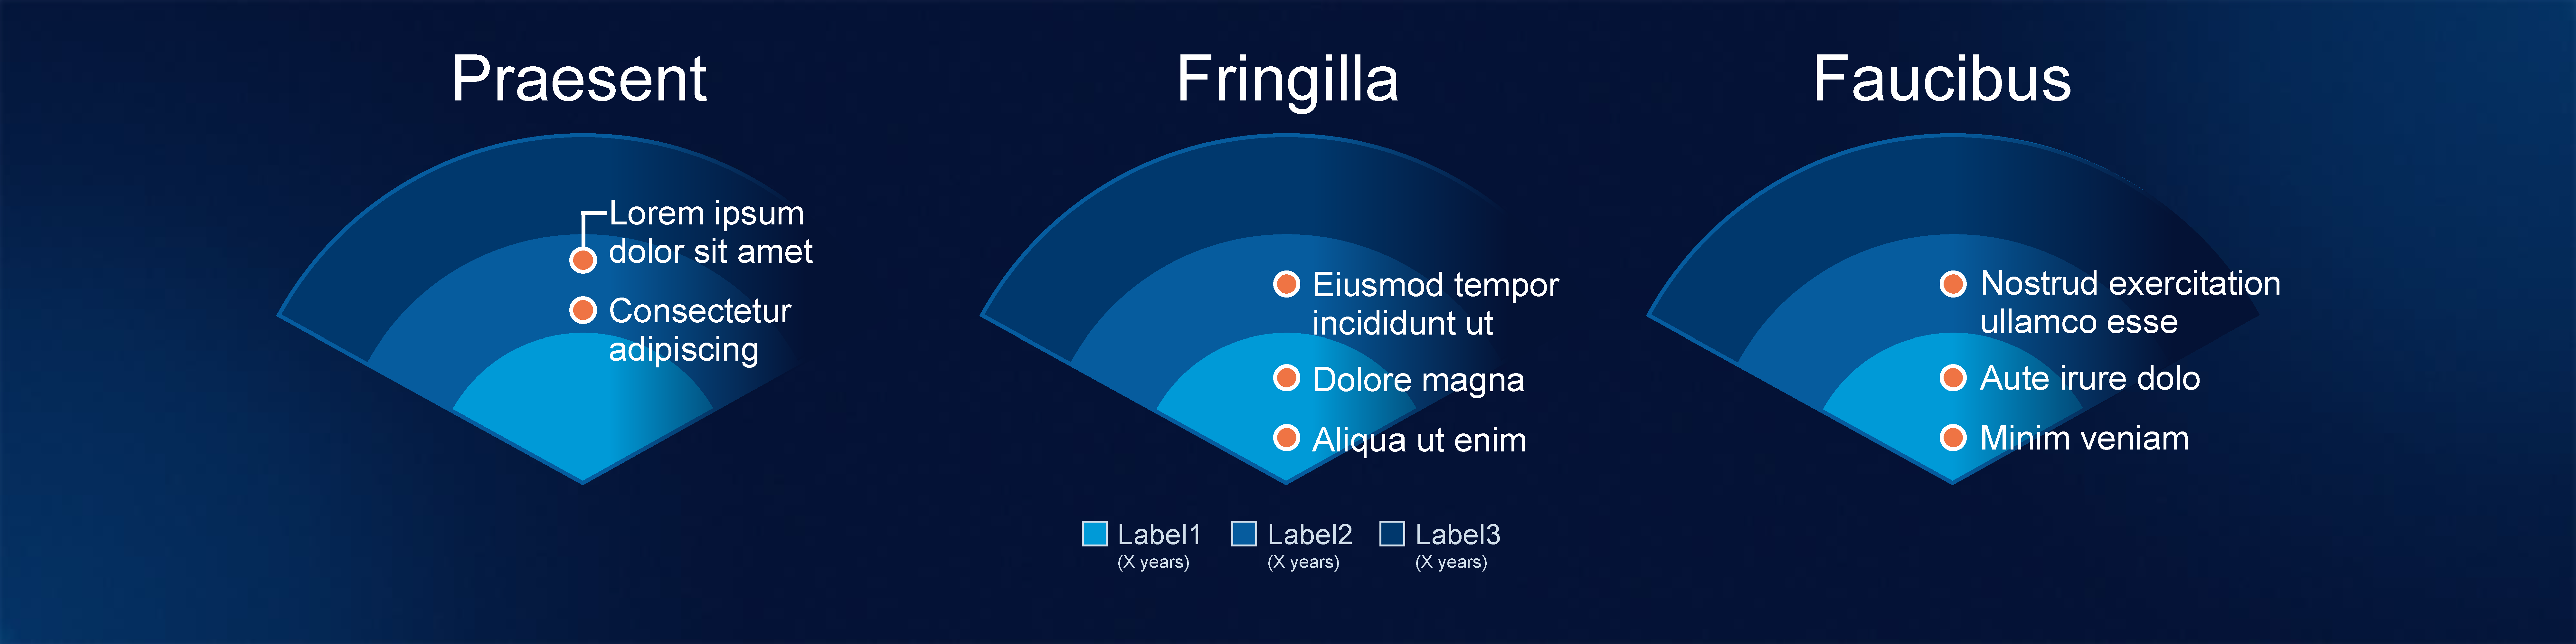
Quantum Computing
︎︎︎GartnerOrganization was achieved by adding in a visual timeline (Year 0-10+) to measure the projections, describing each arrow/movement, and by differentiating each era by using color.

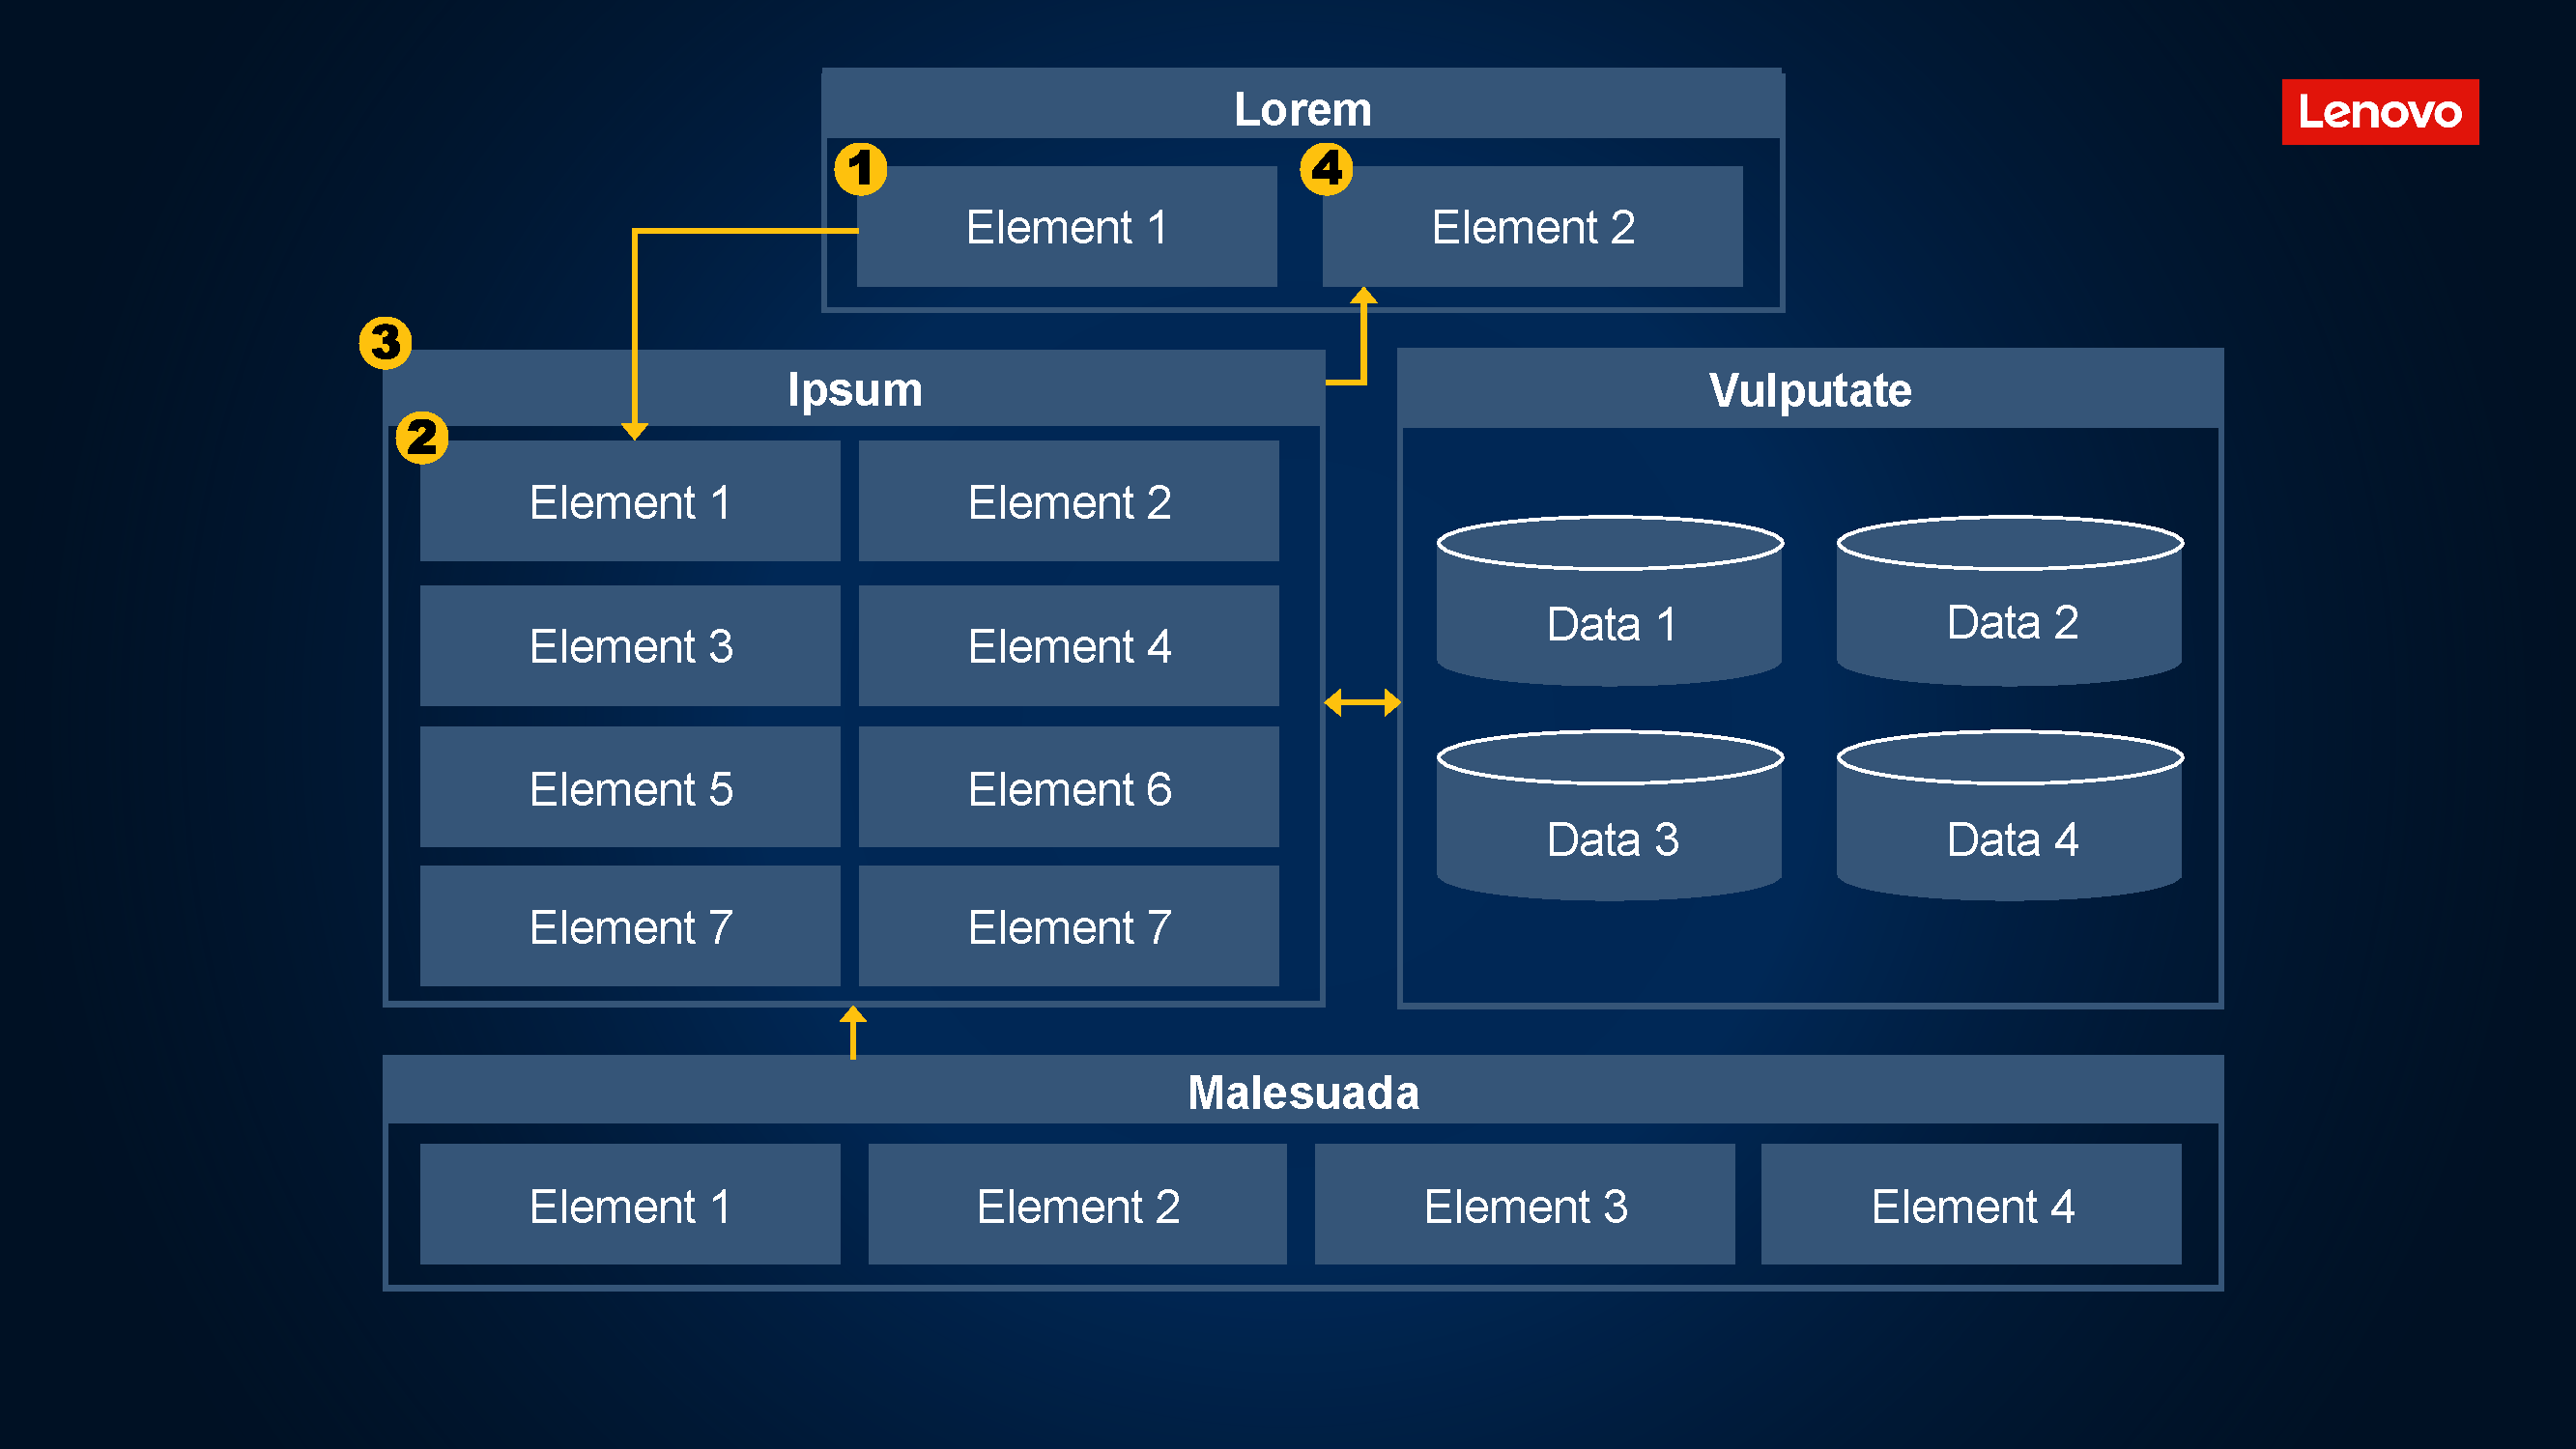
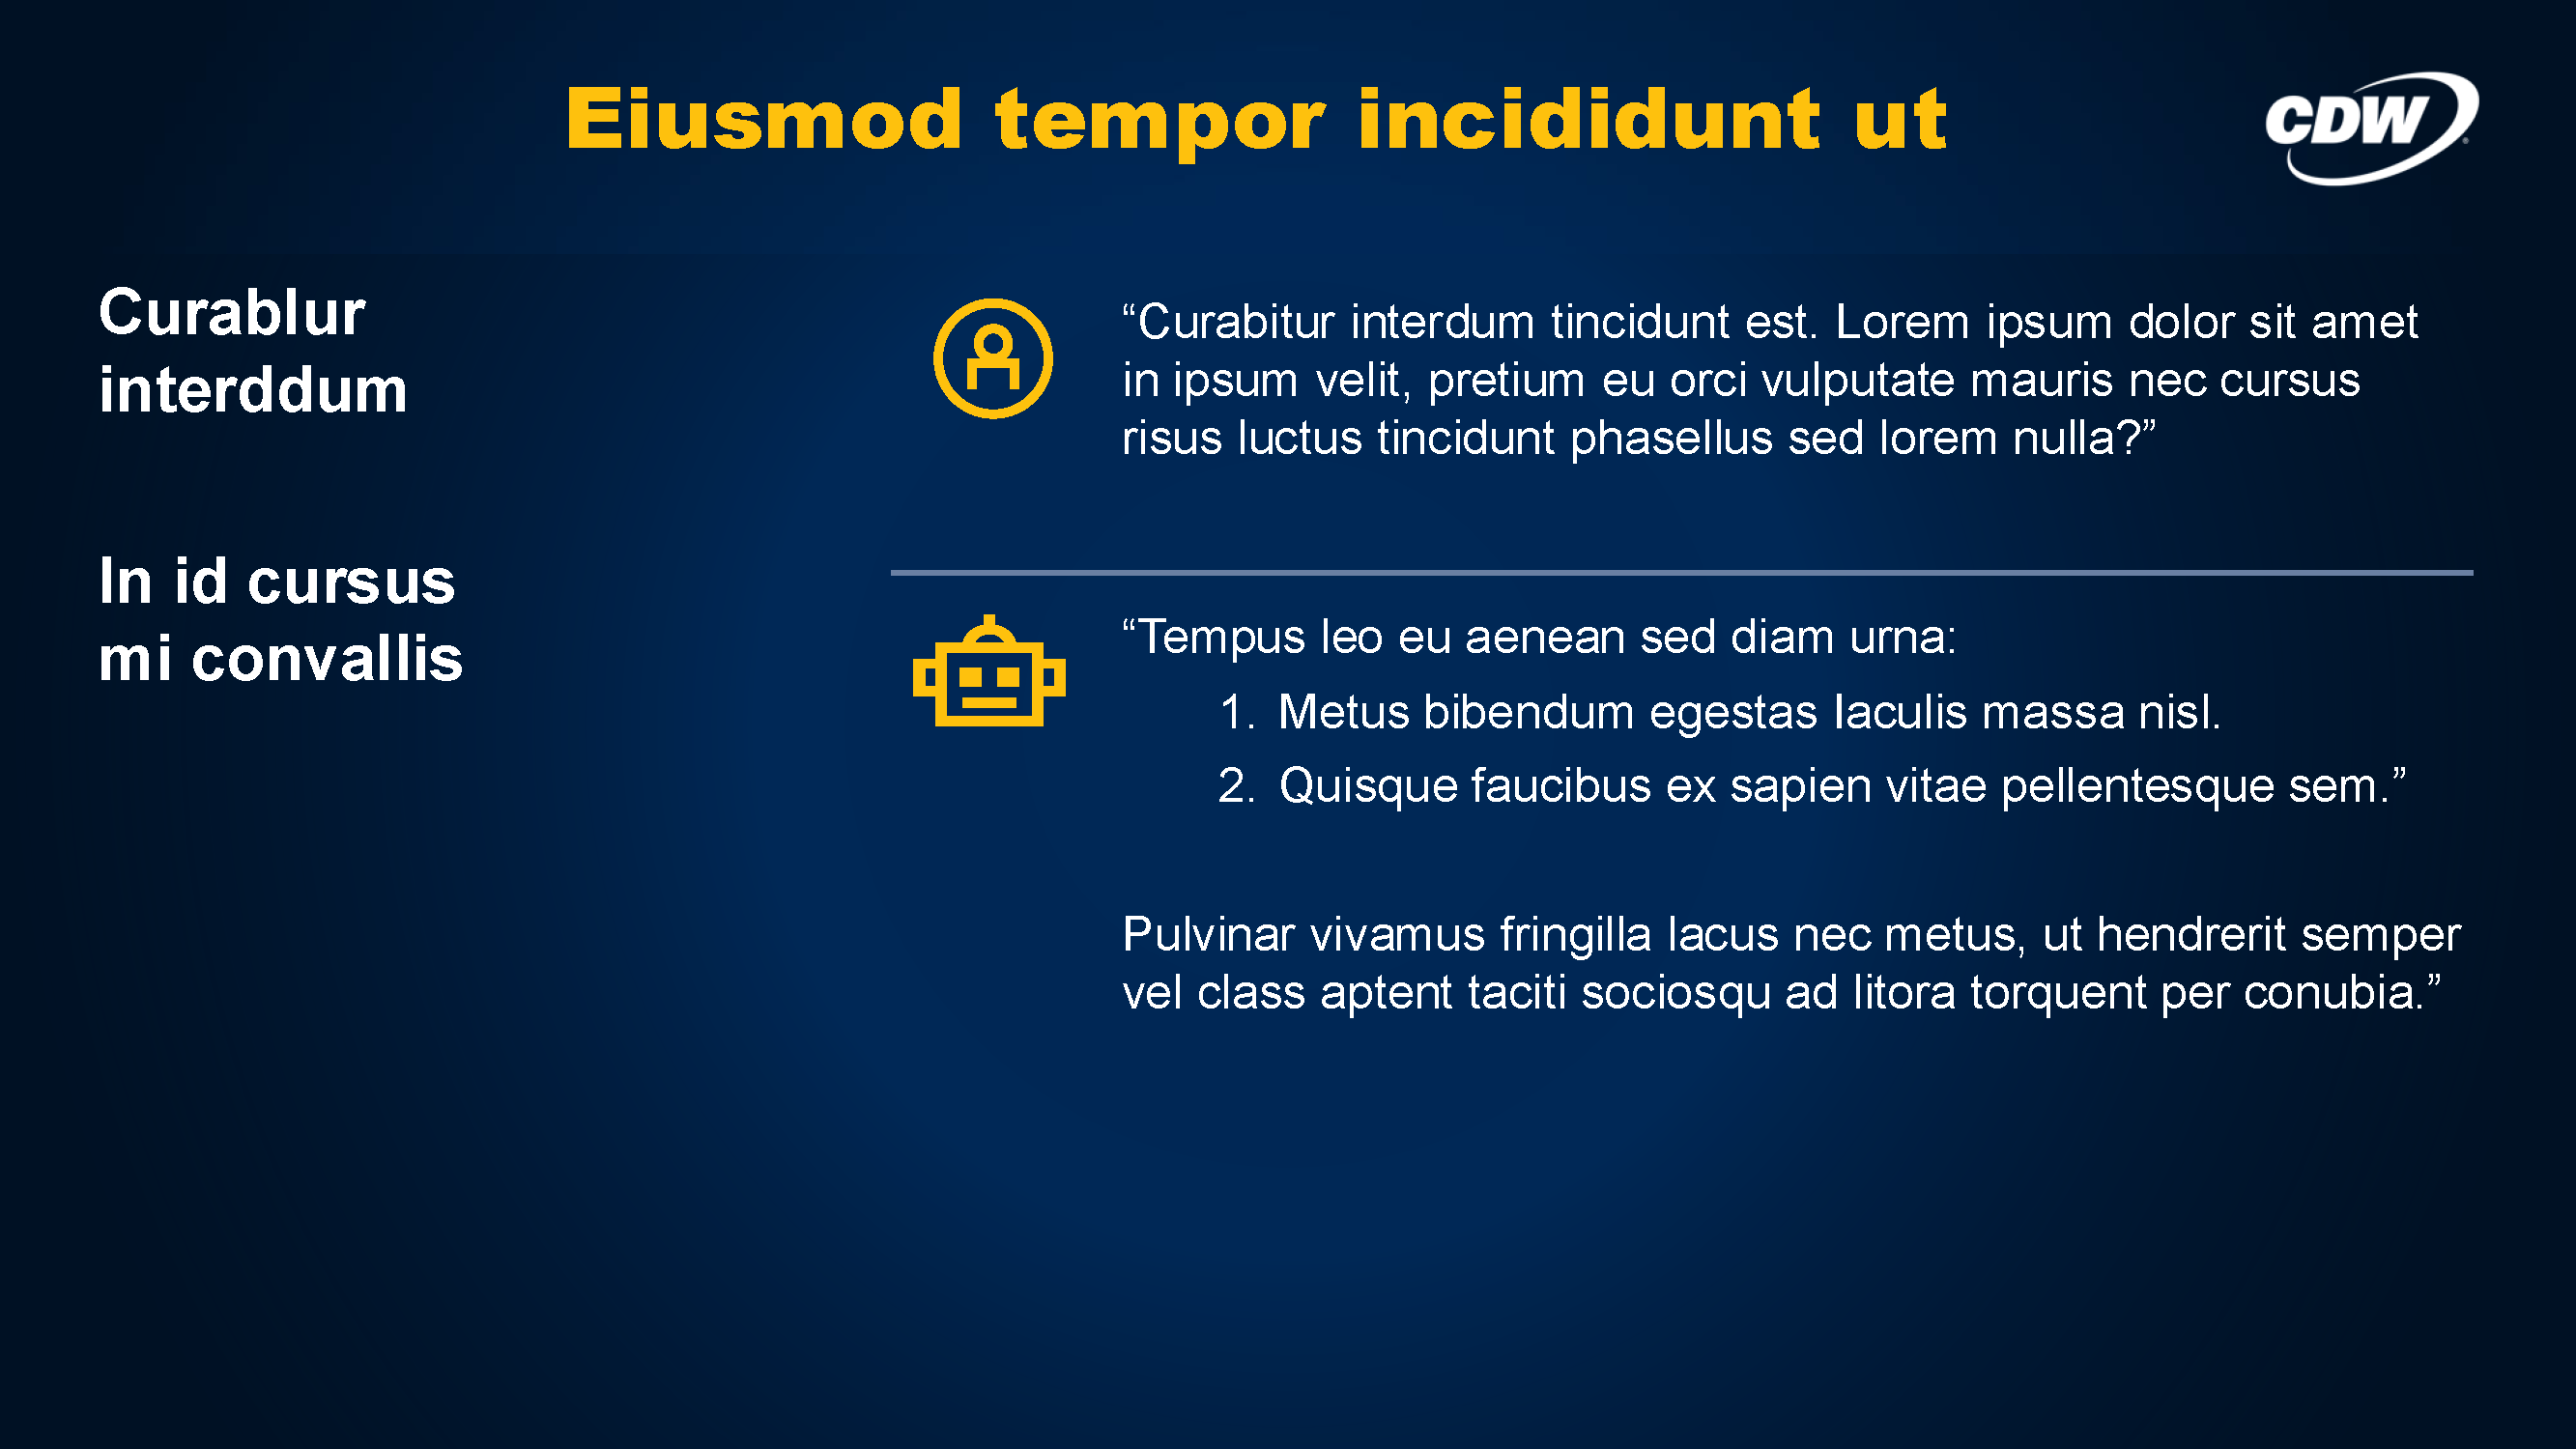
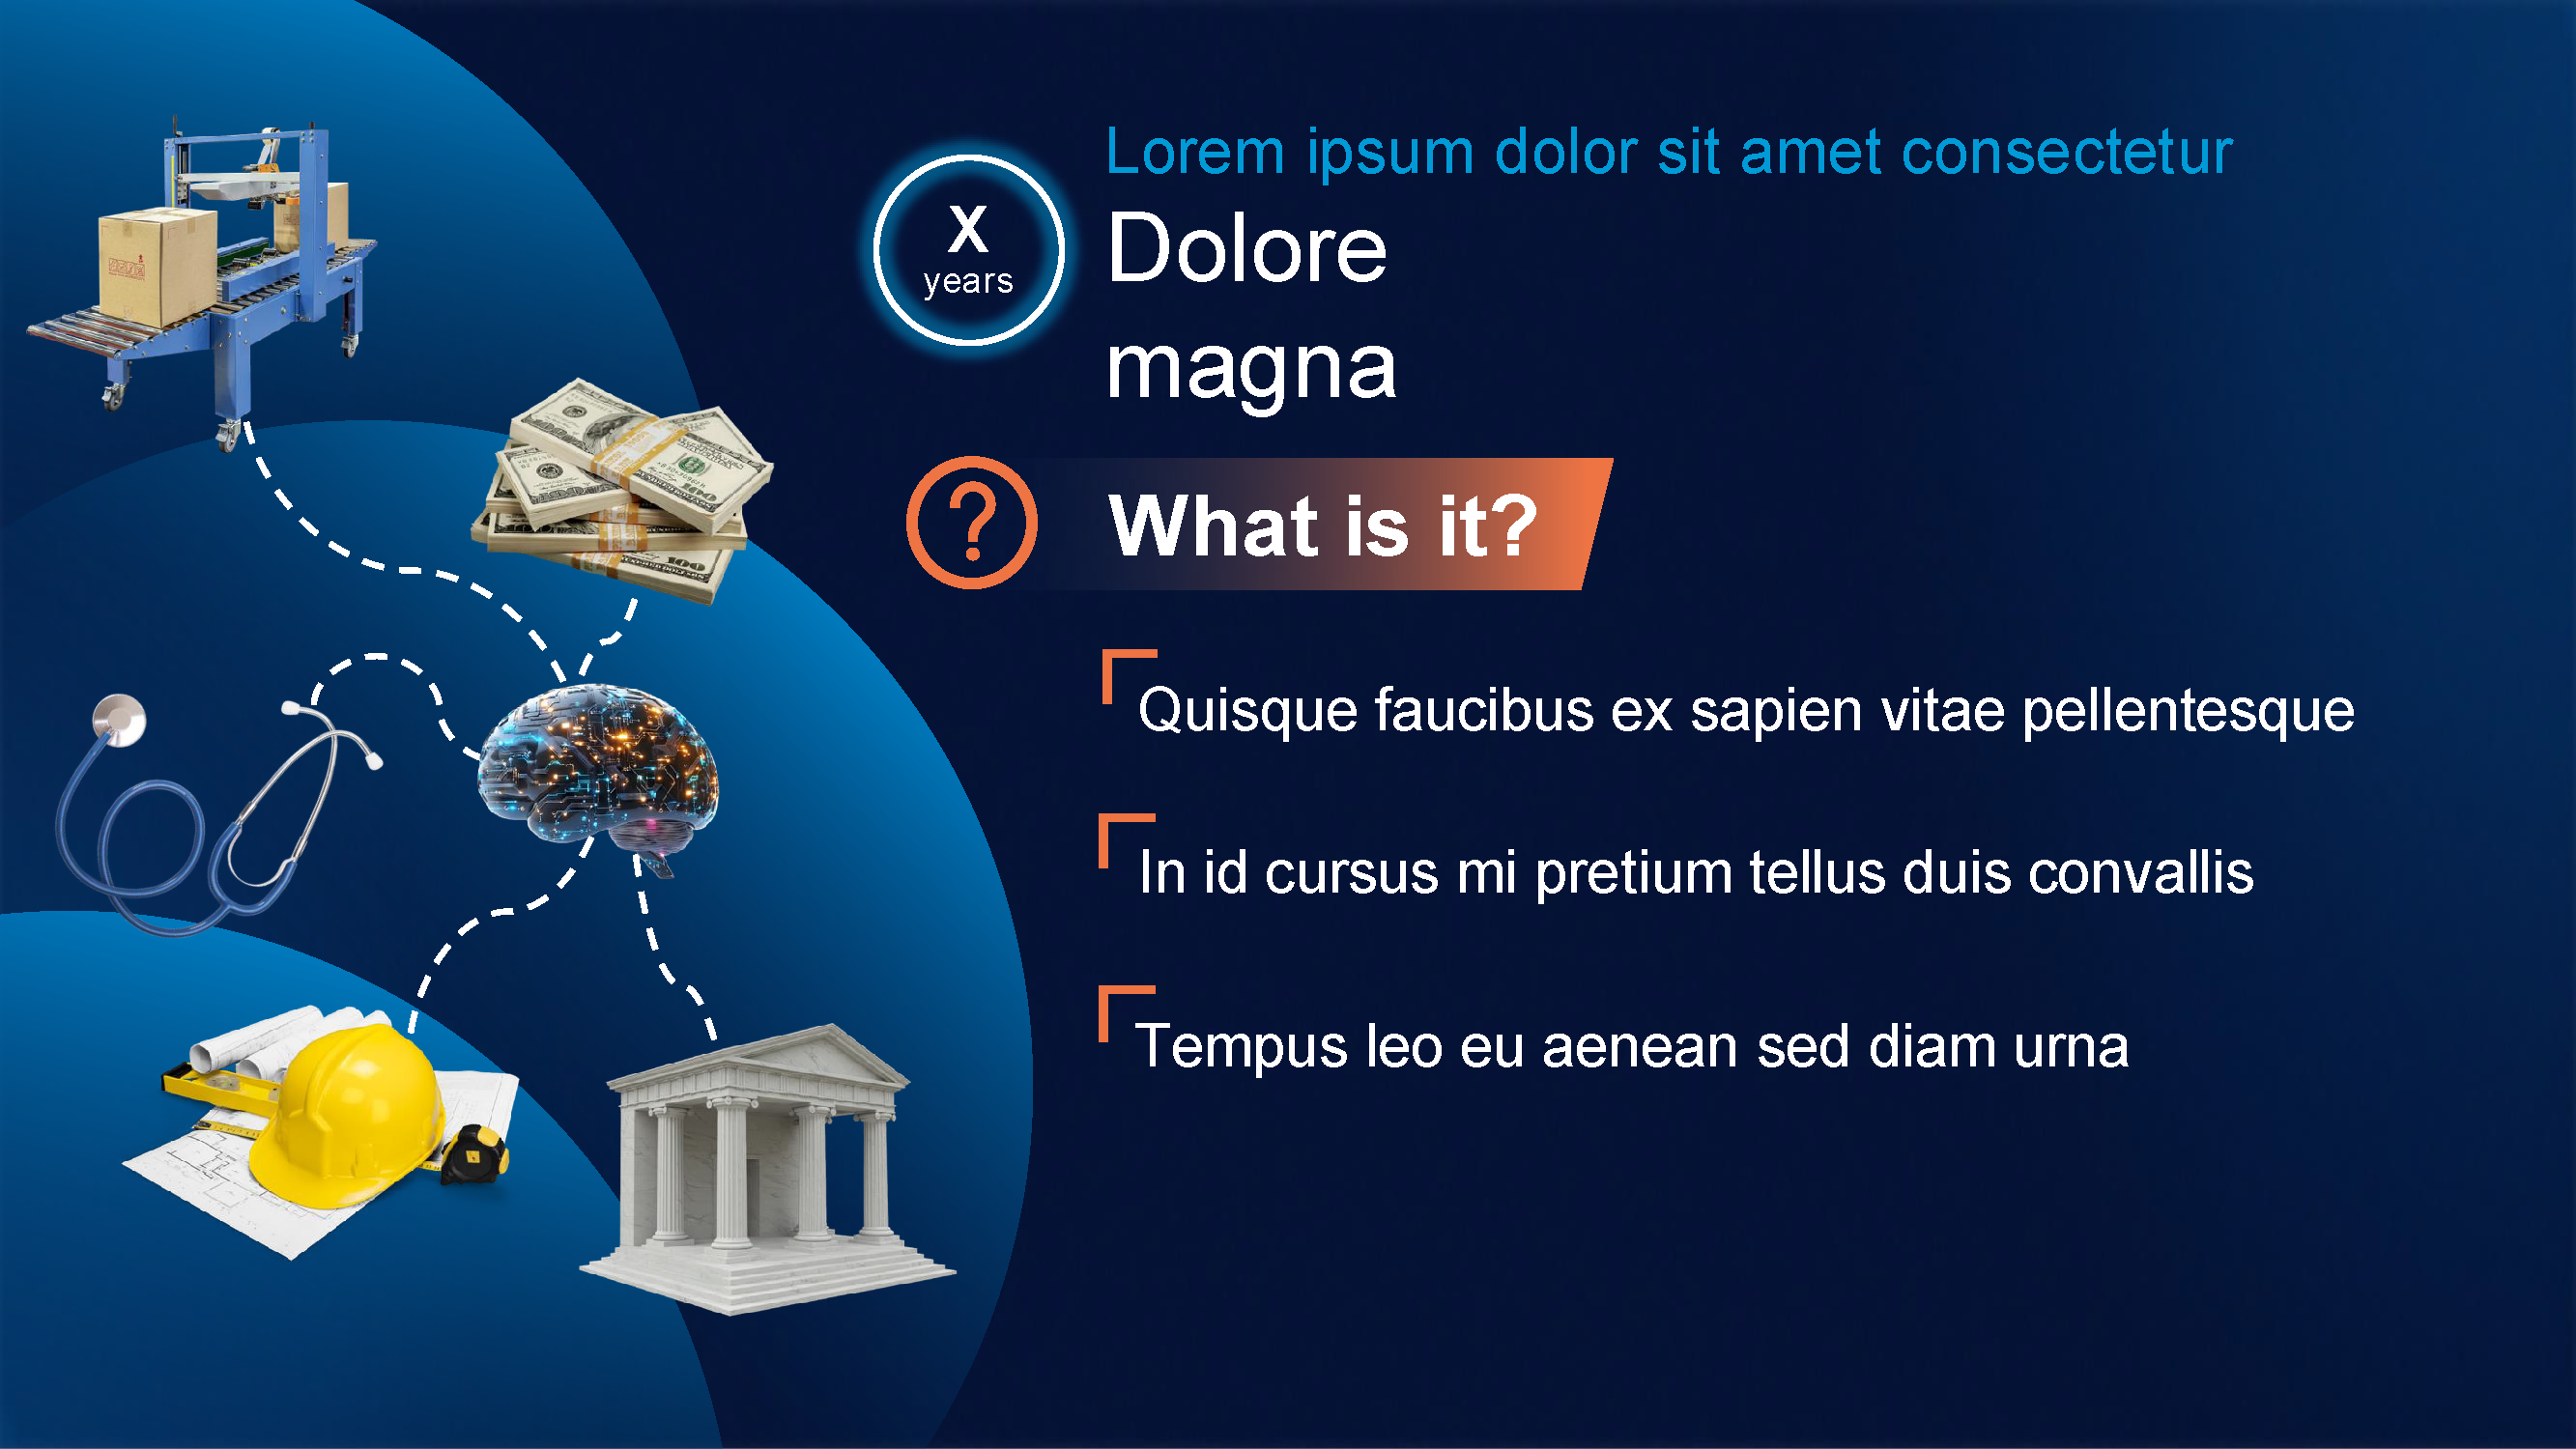
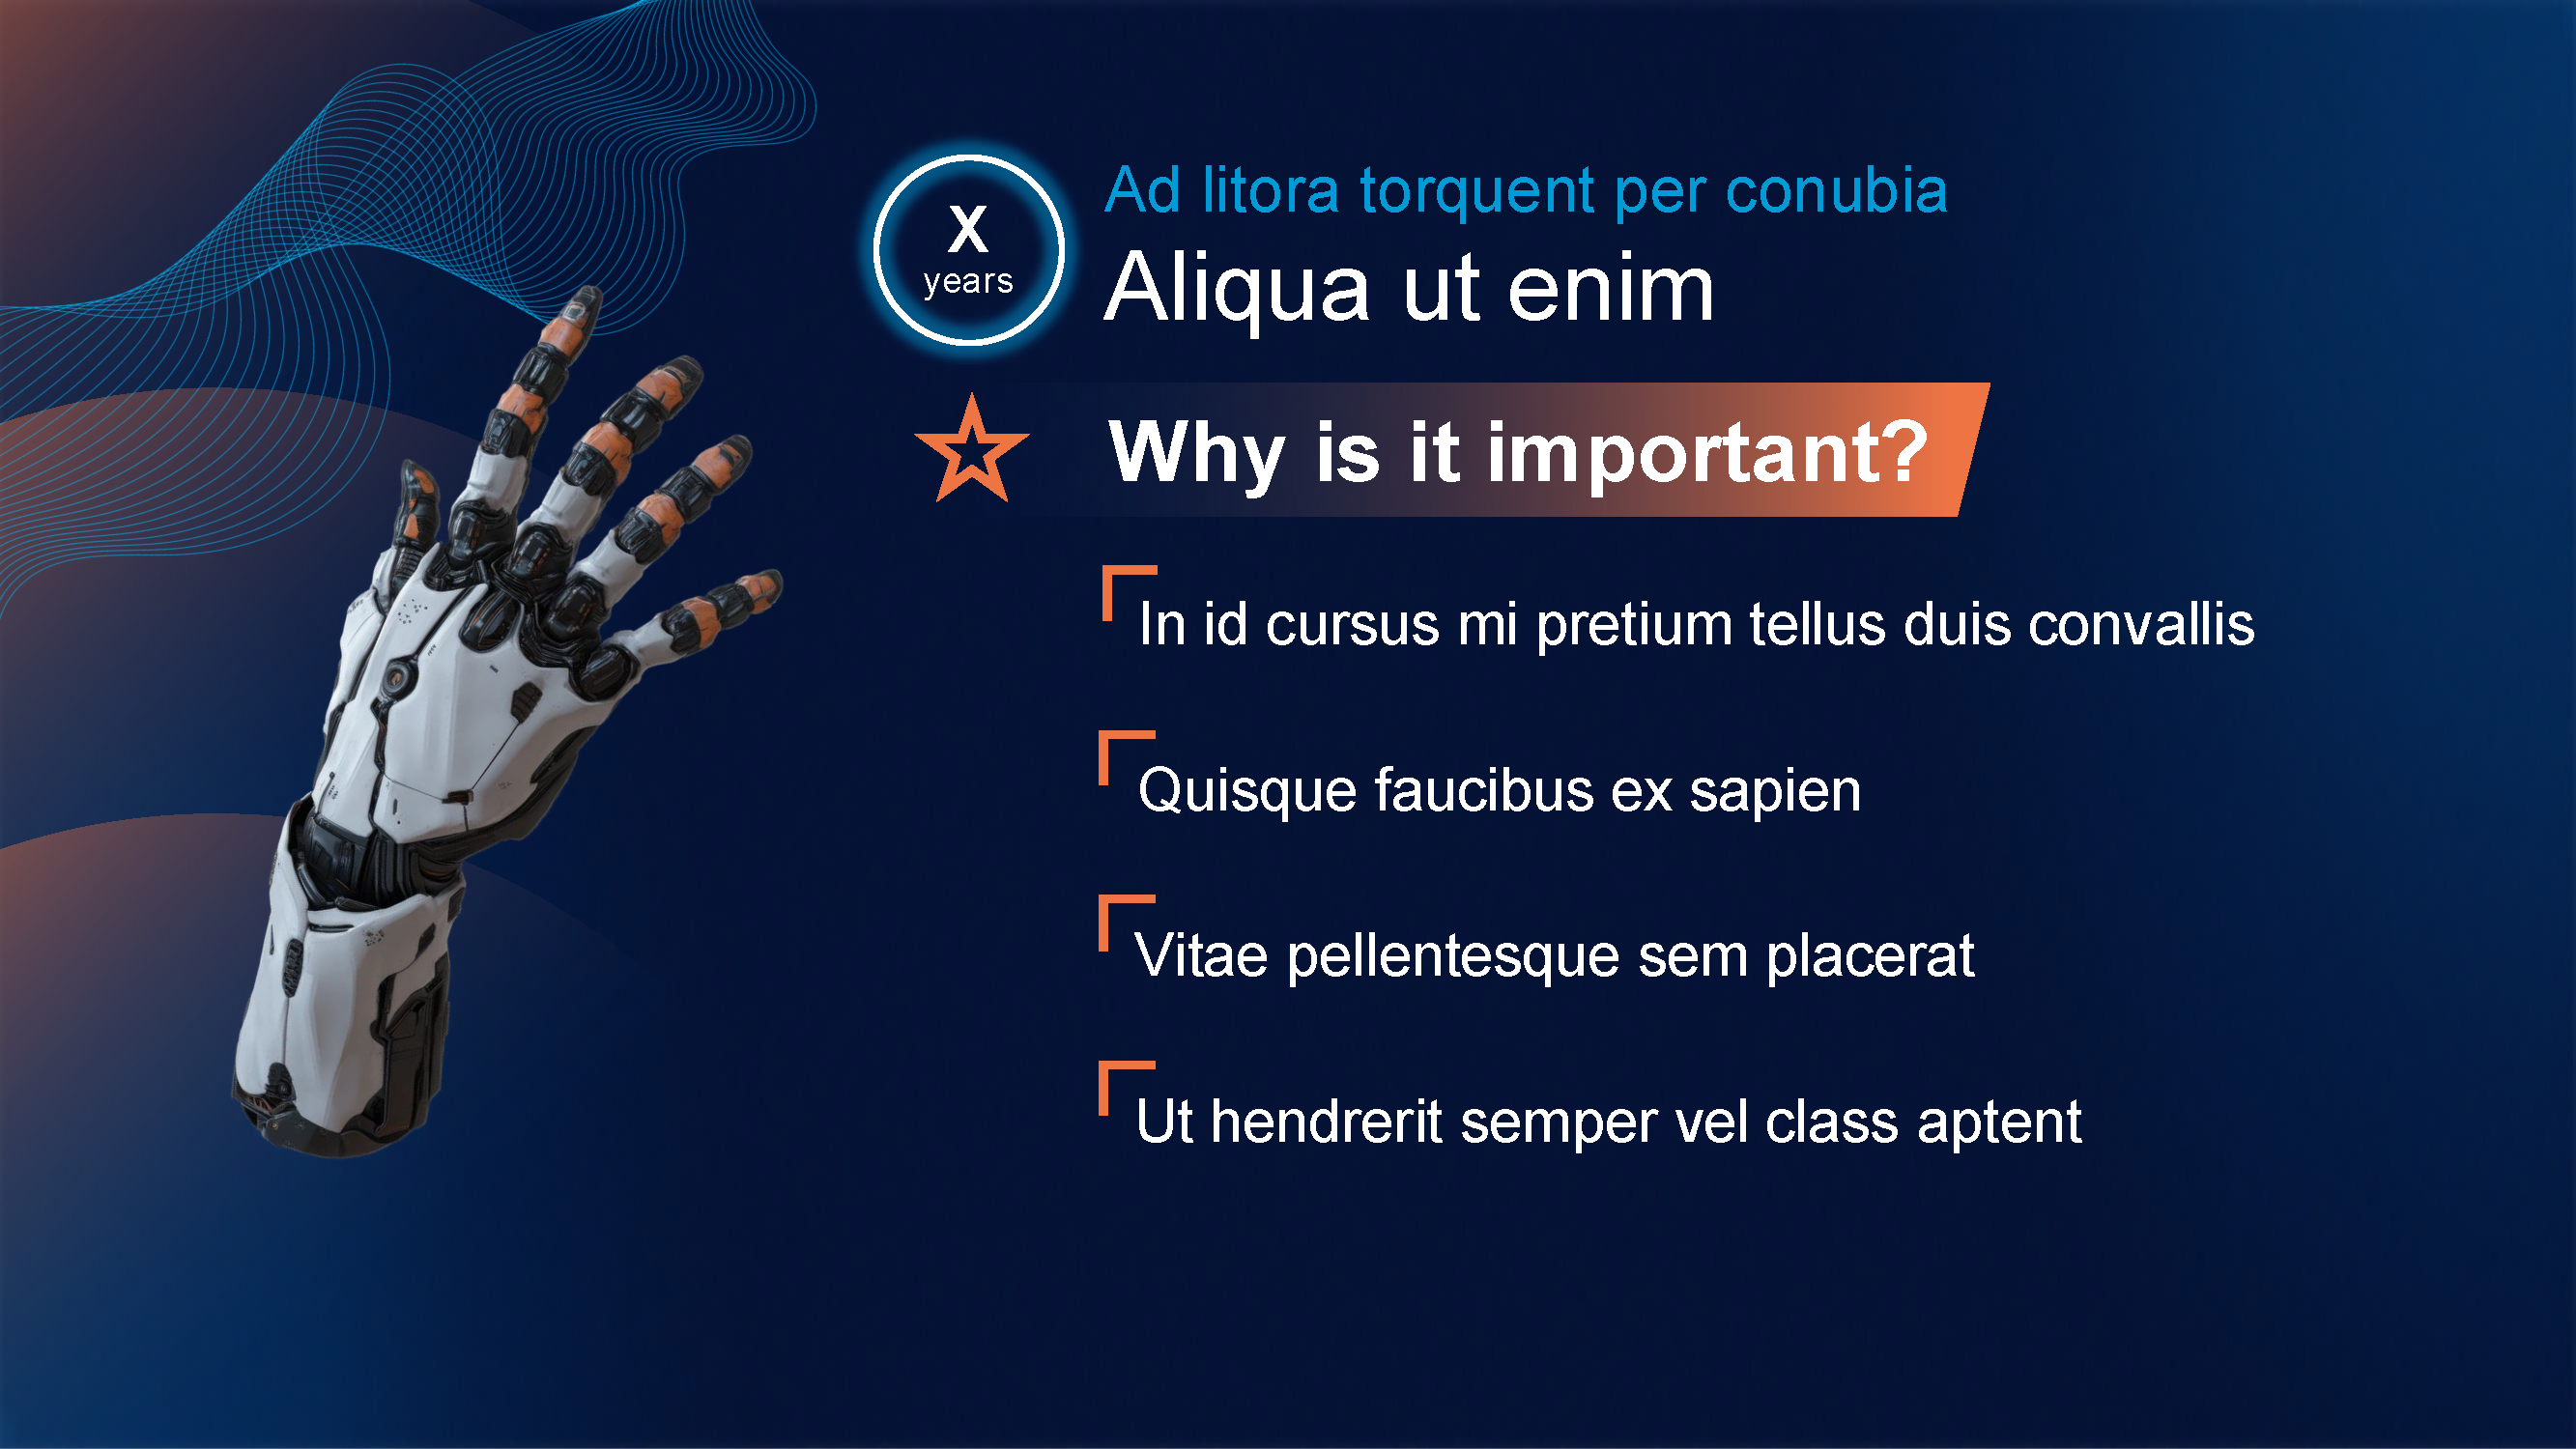
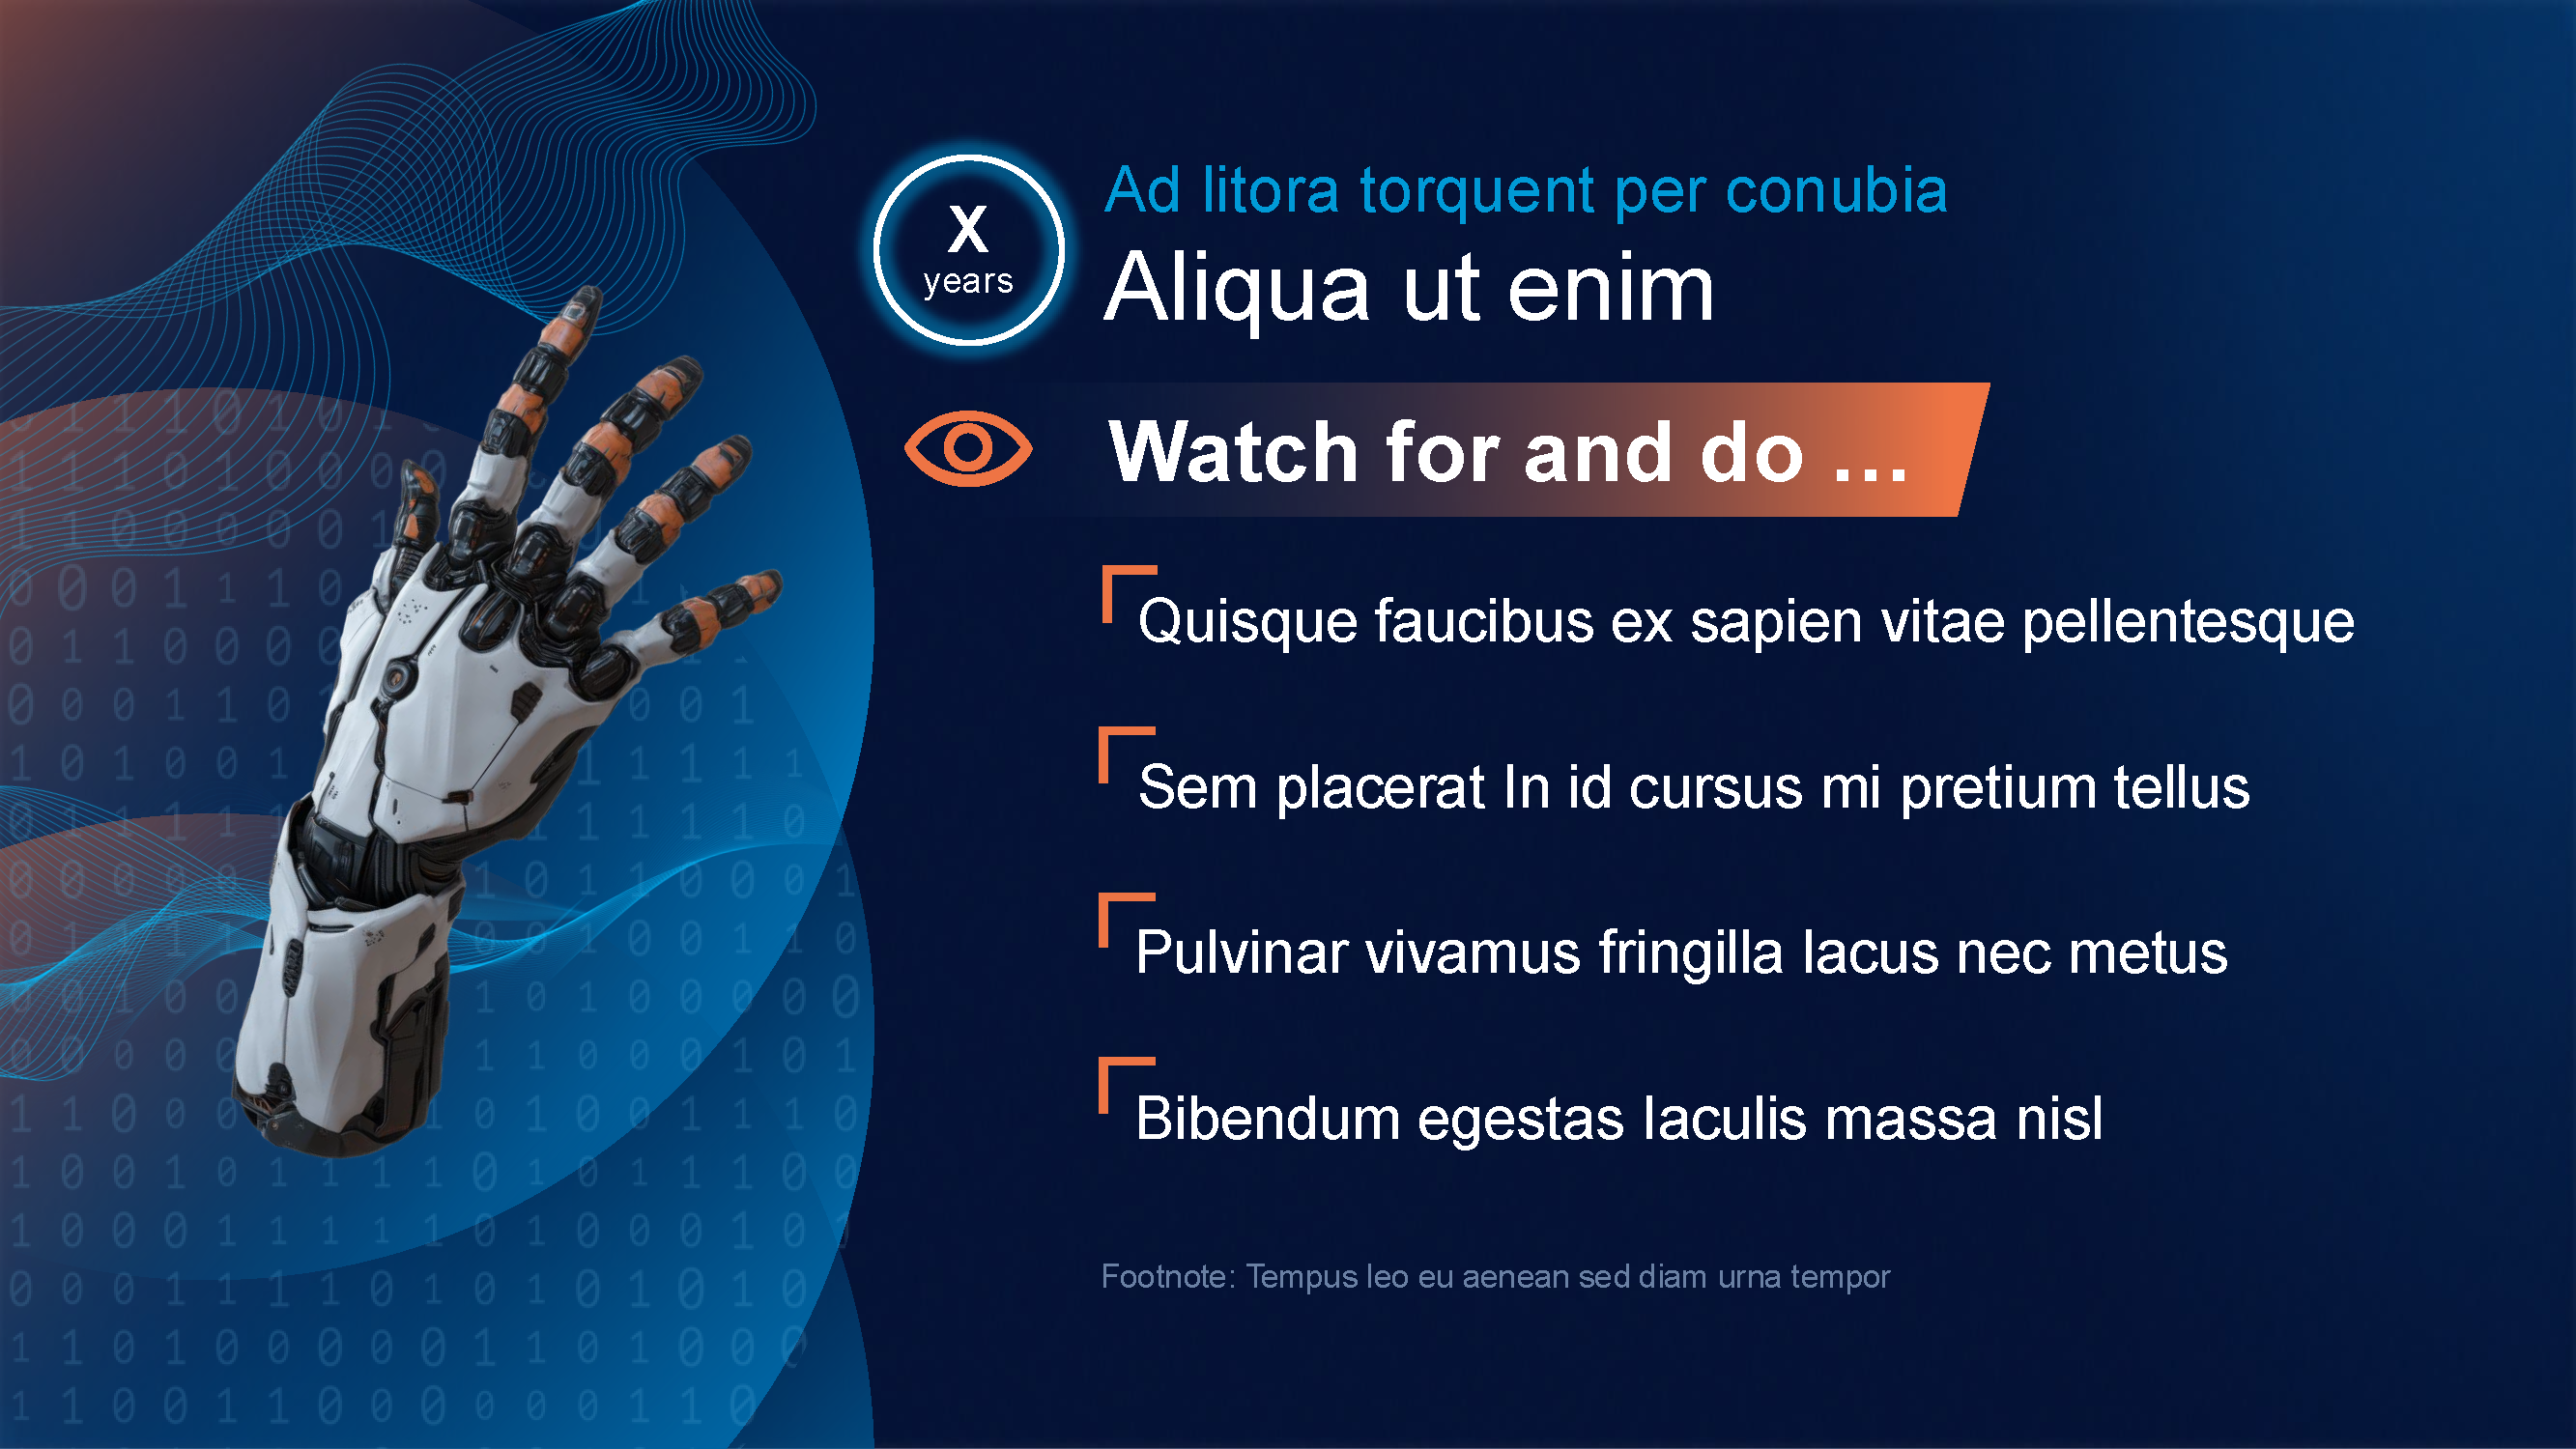
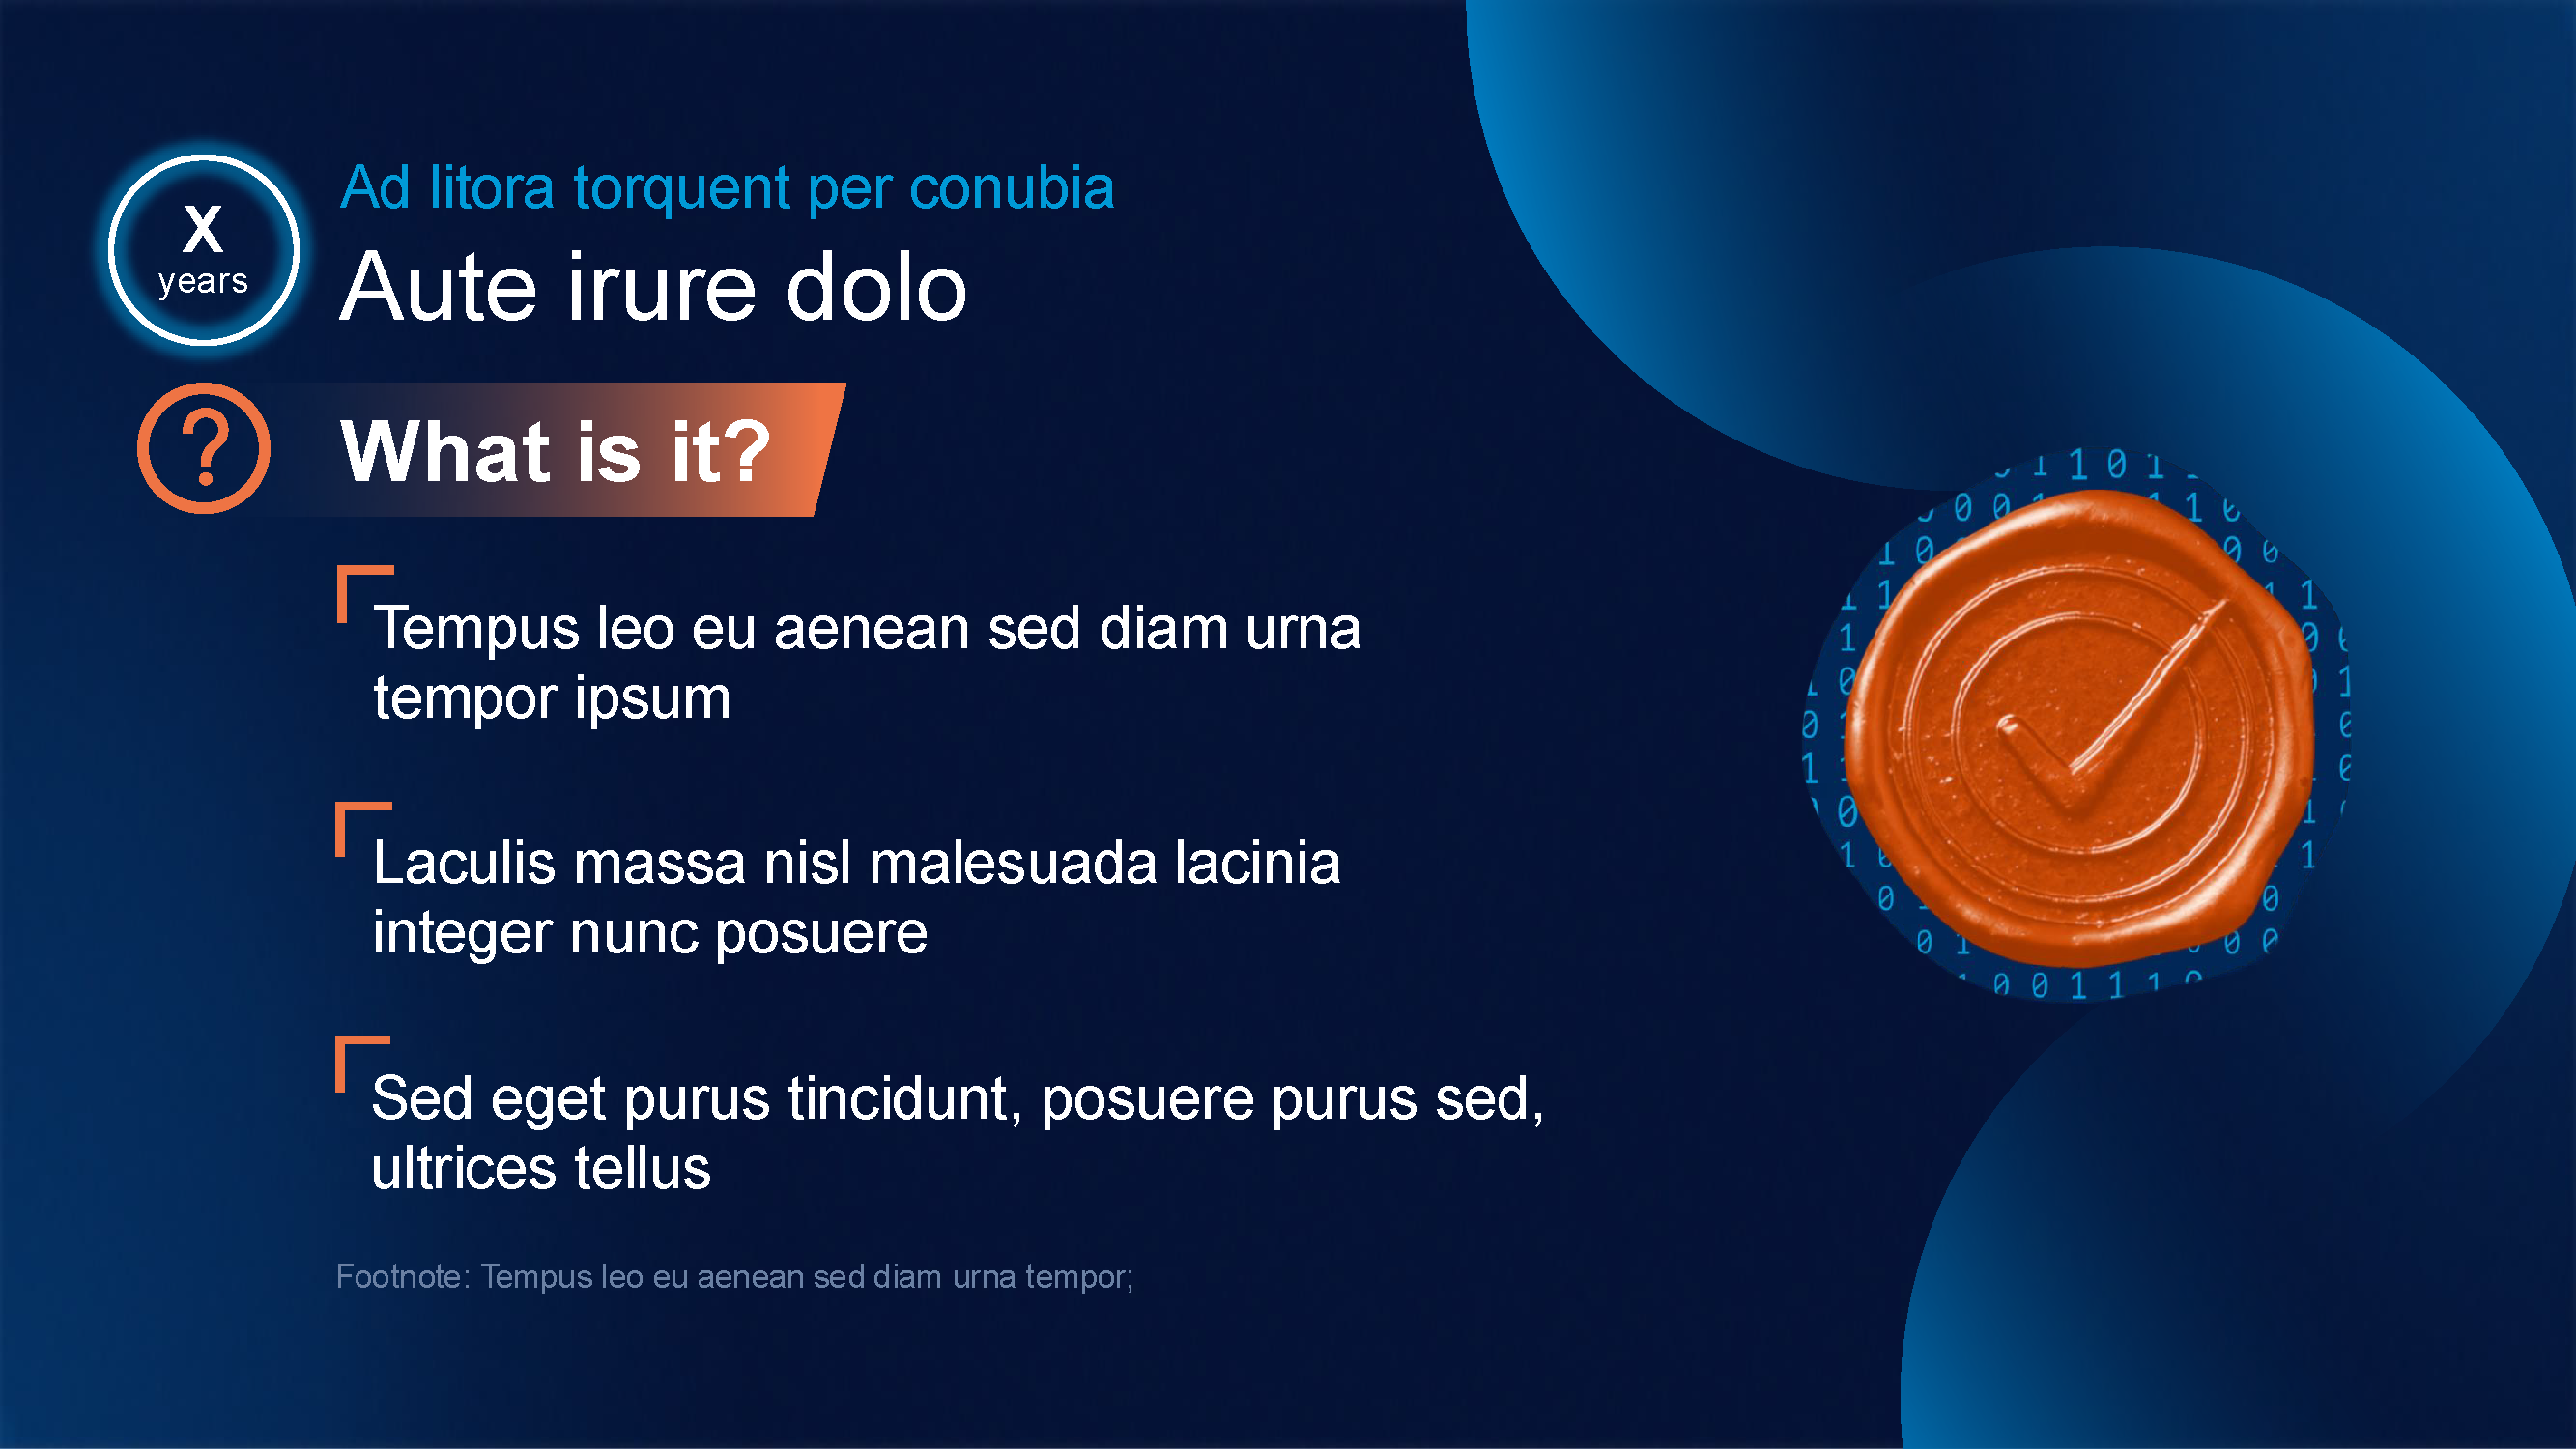
Machine Identities
︎︎︎Gartner
Top graphic: Clarified the context of the graphic: What the “gaps” within the working group are, and what the relationship of the six core elements are. For consistency, it was turned into a circle.
Bottom graphic: Simplified the process by omitting extra or insignificant steps, and clarified the start by adding in numbers and arrows to clearly guide the reader.

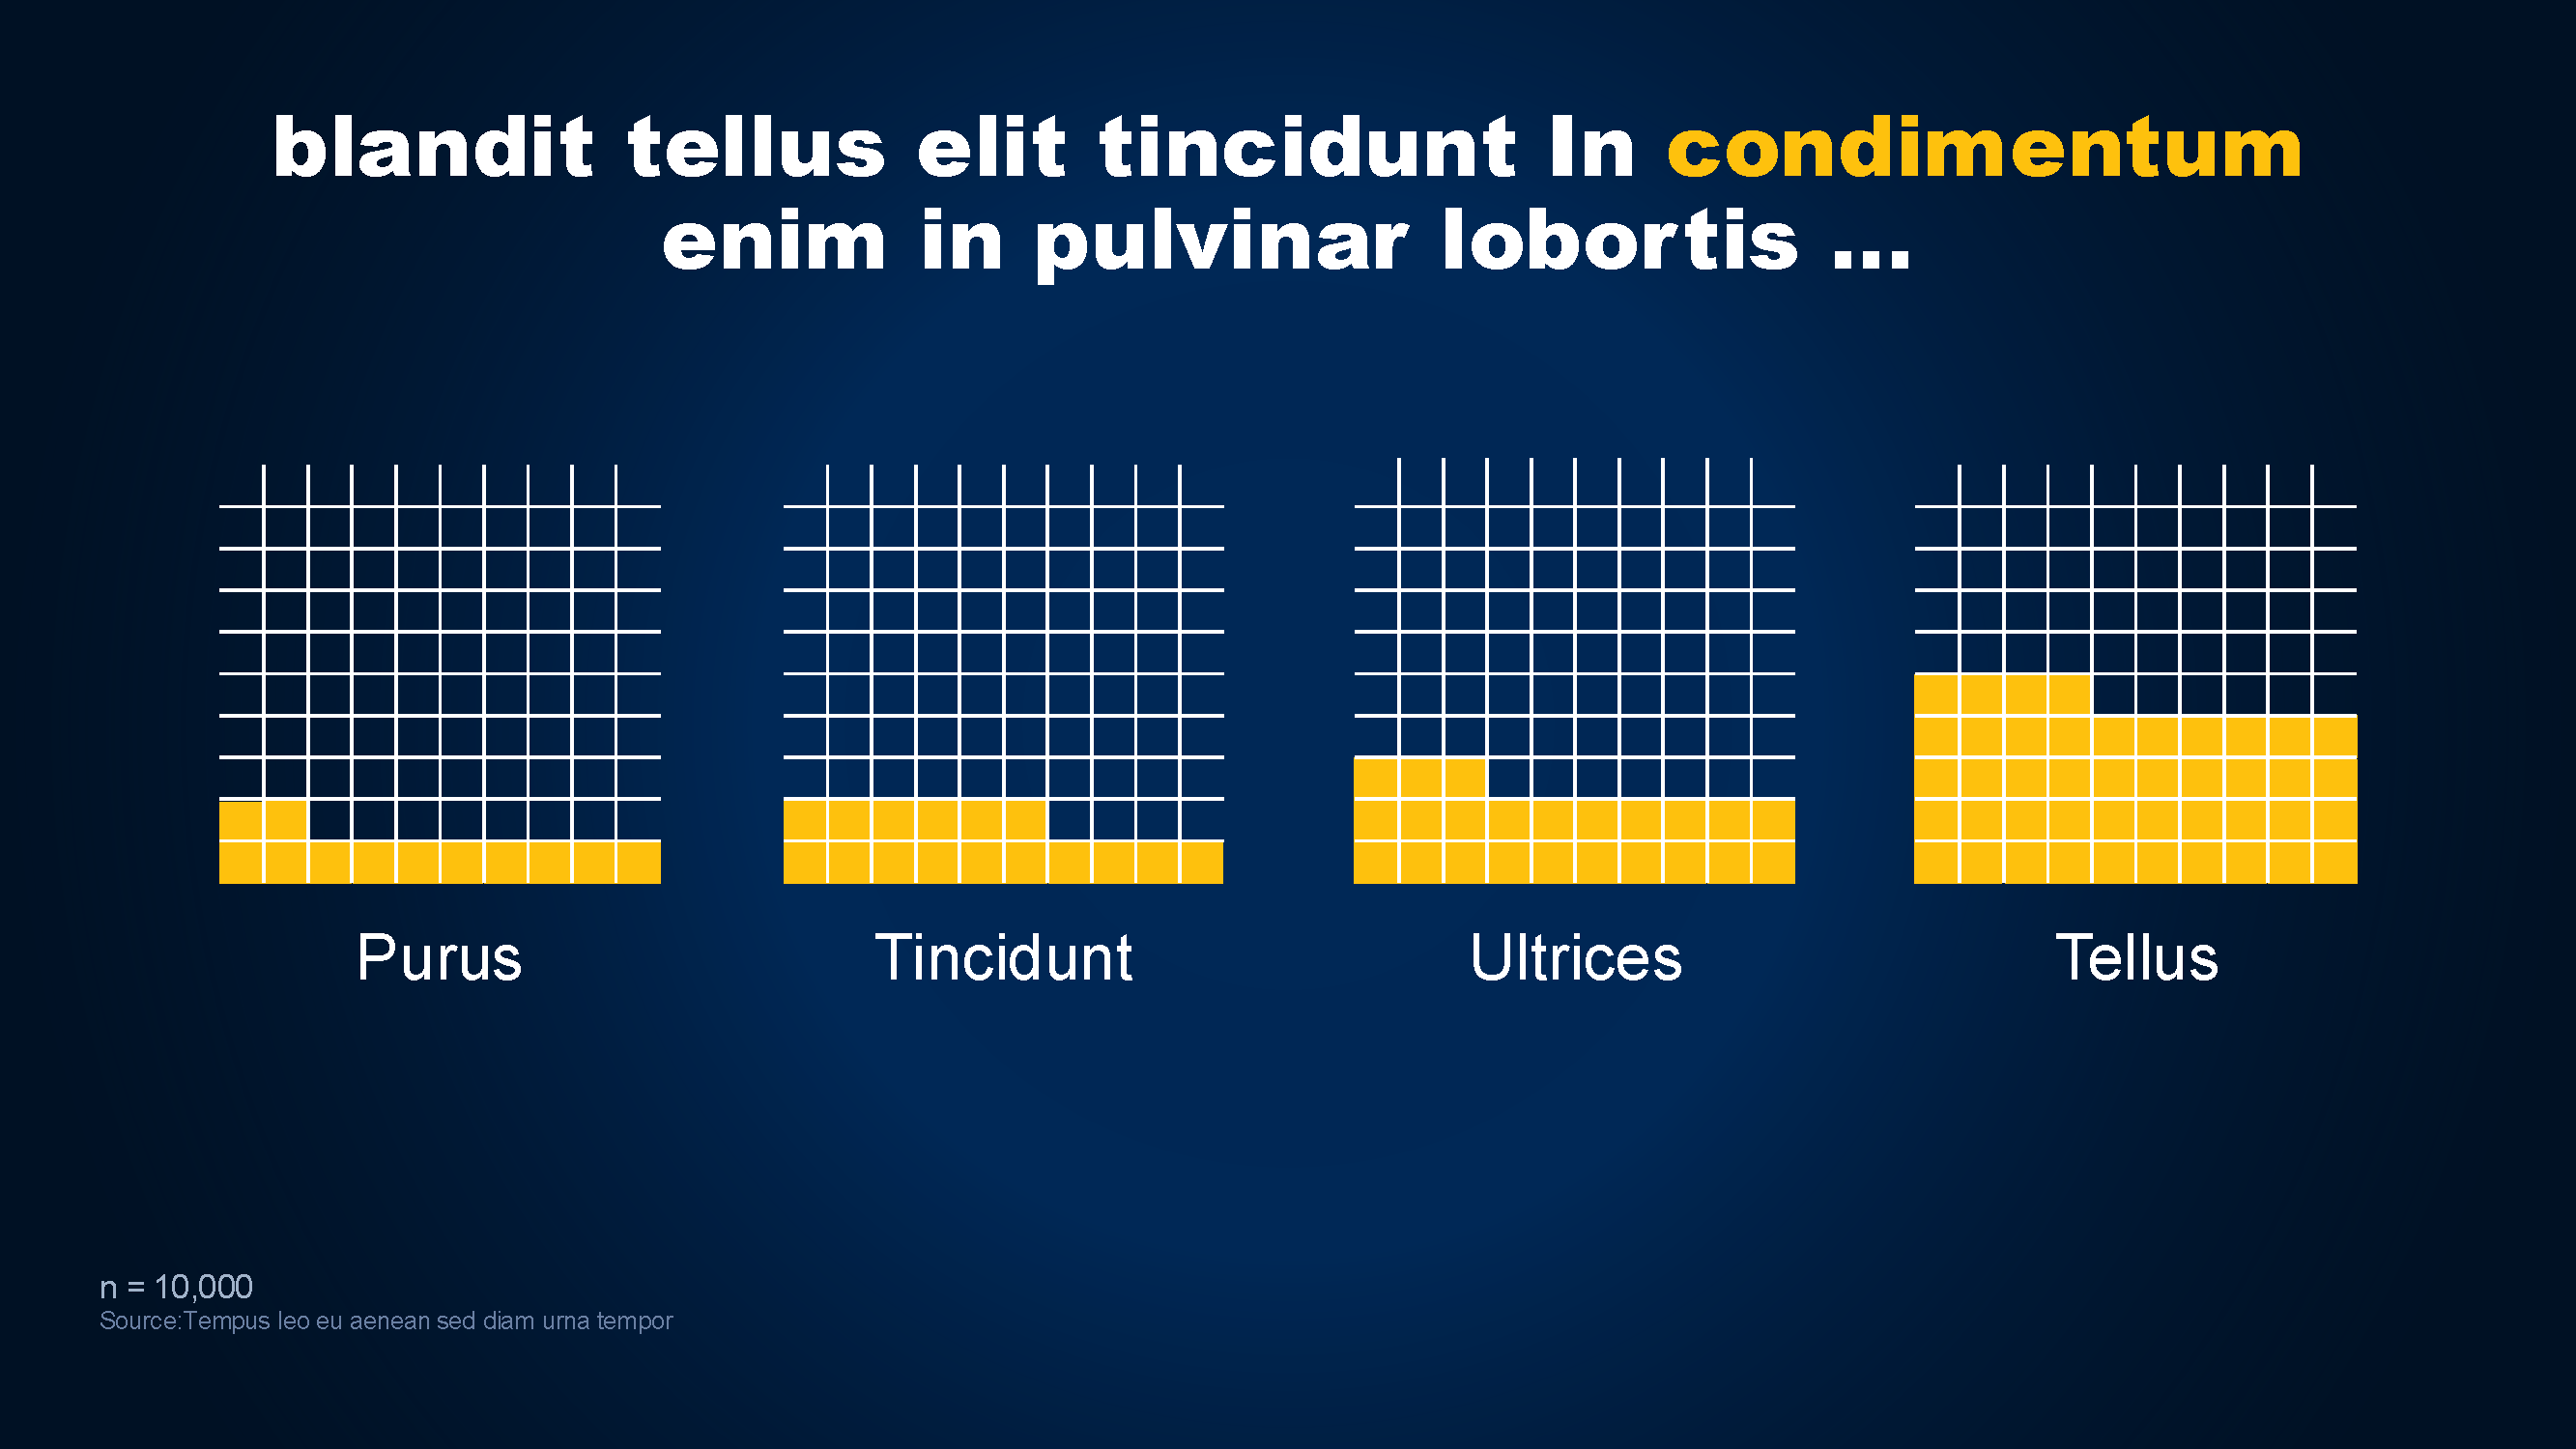
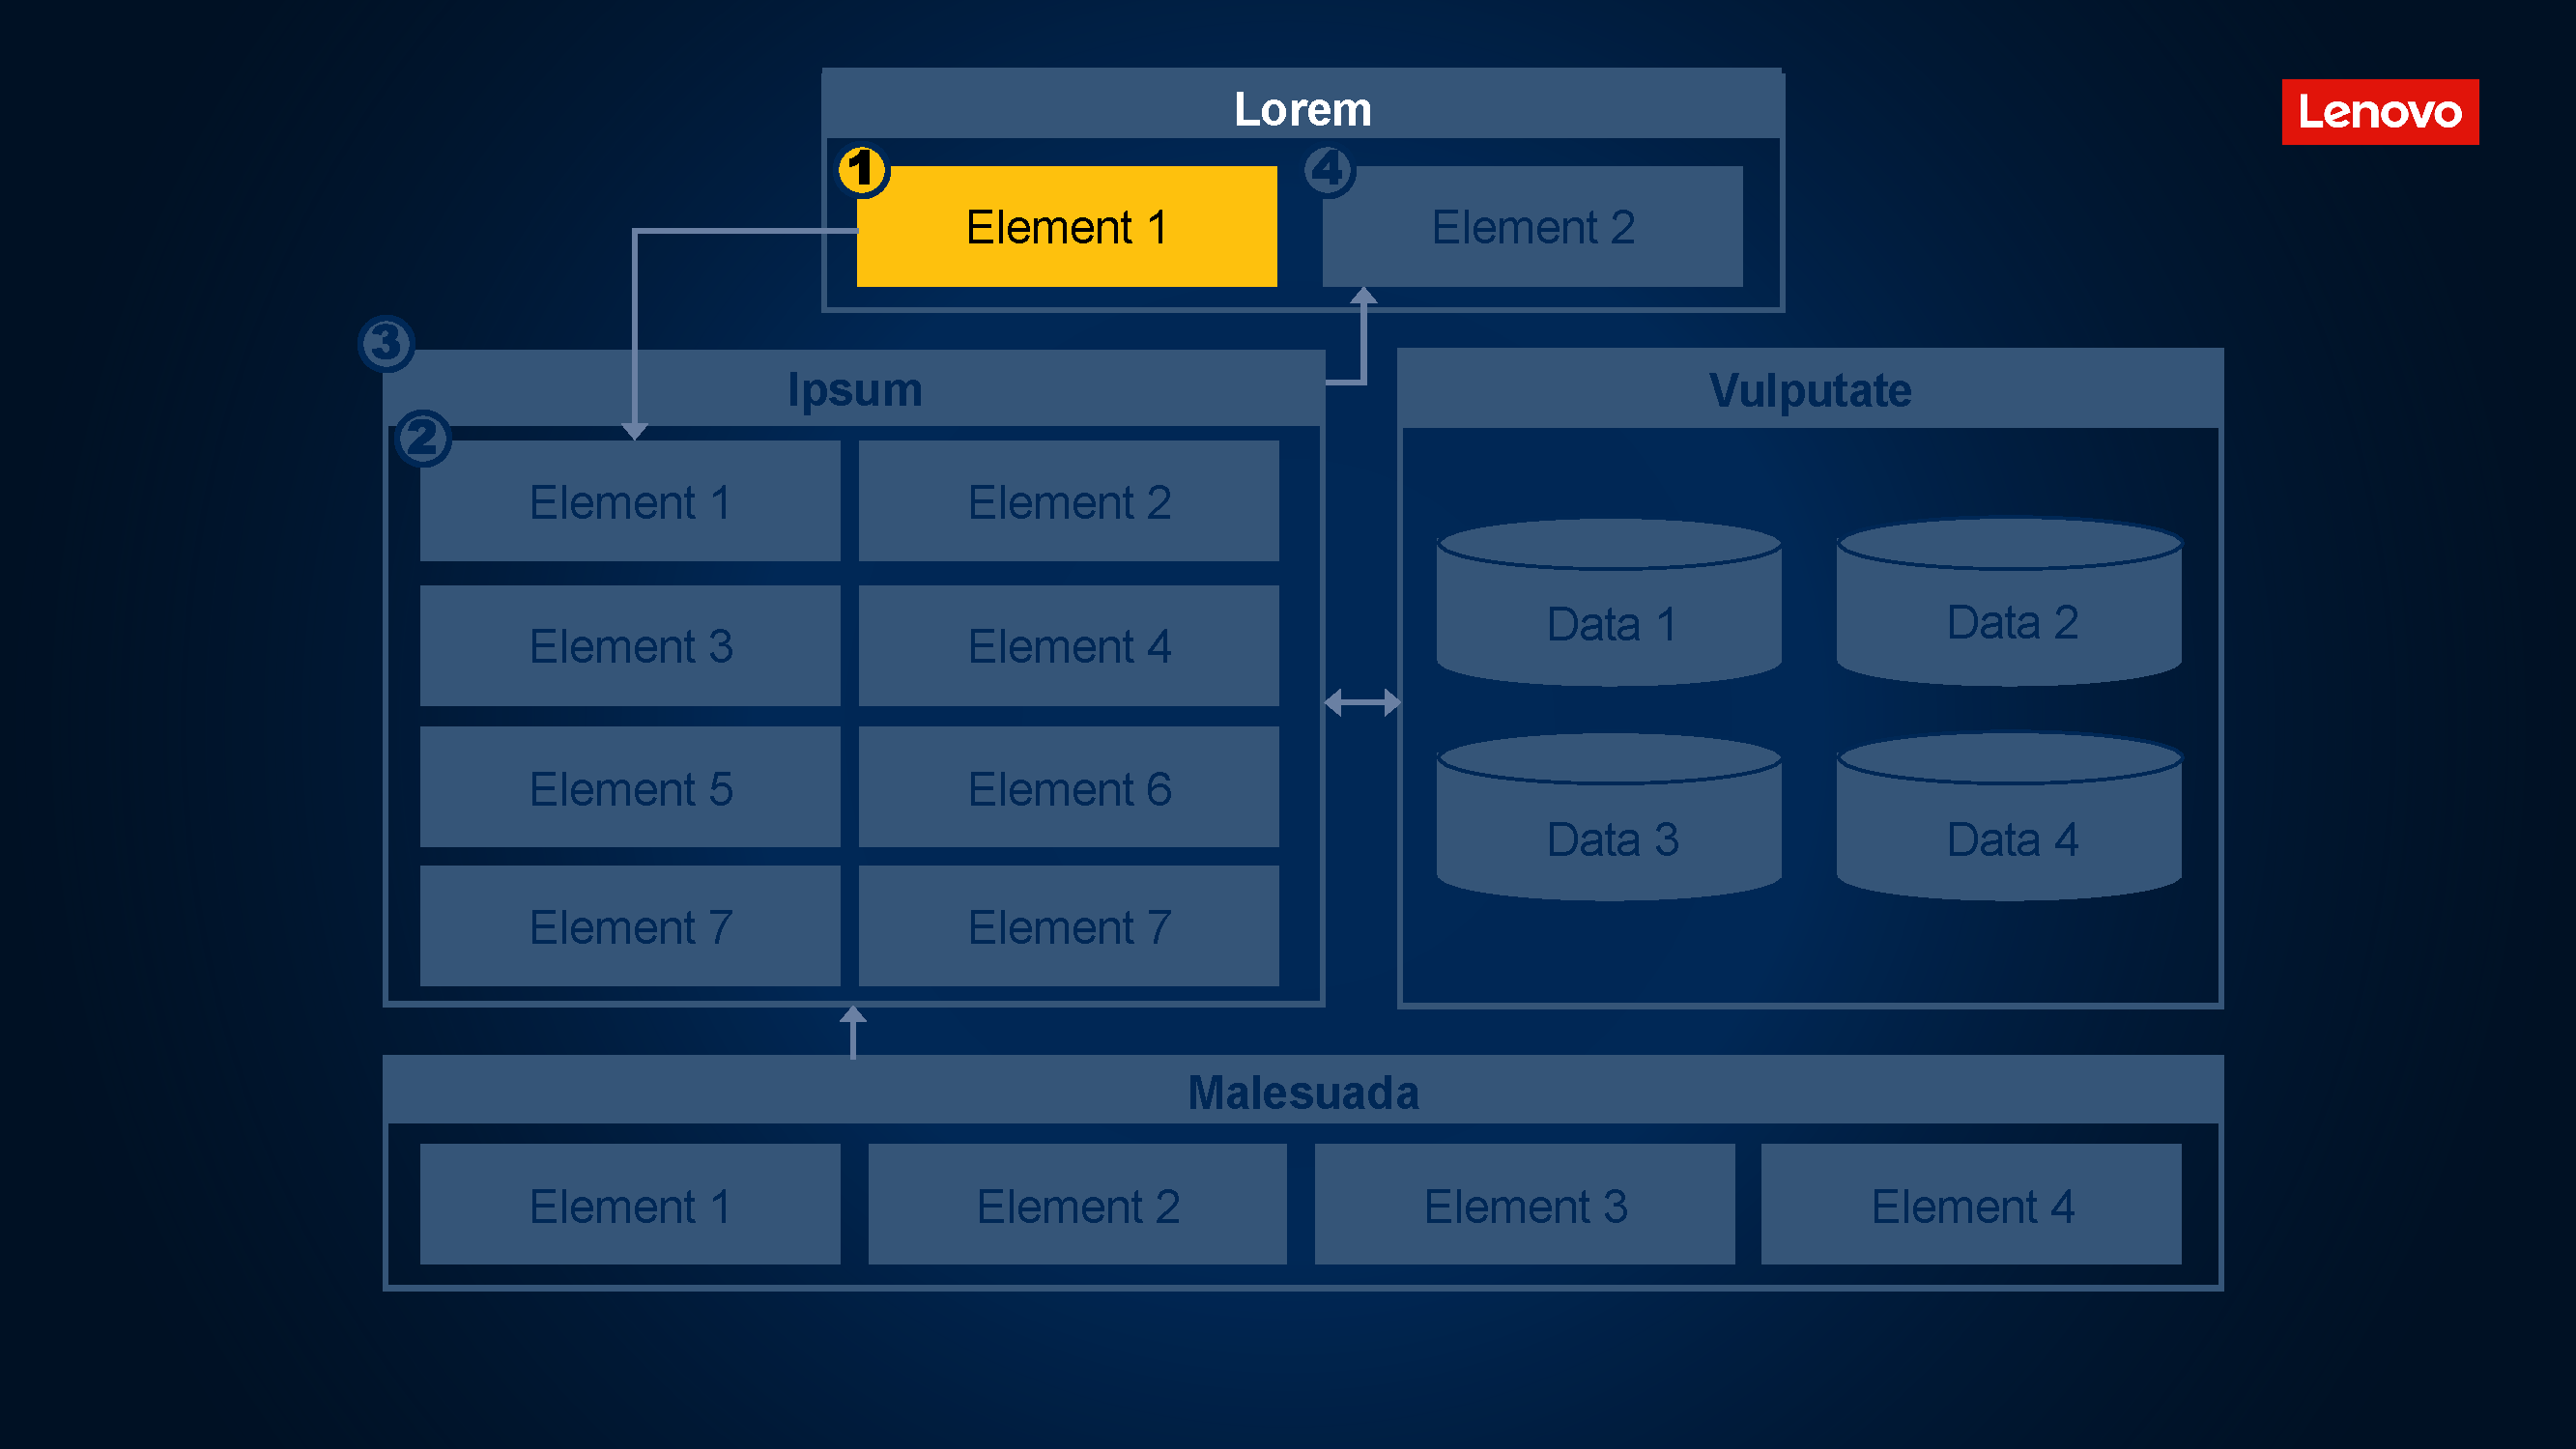
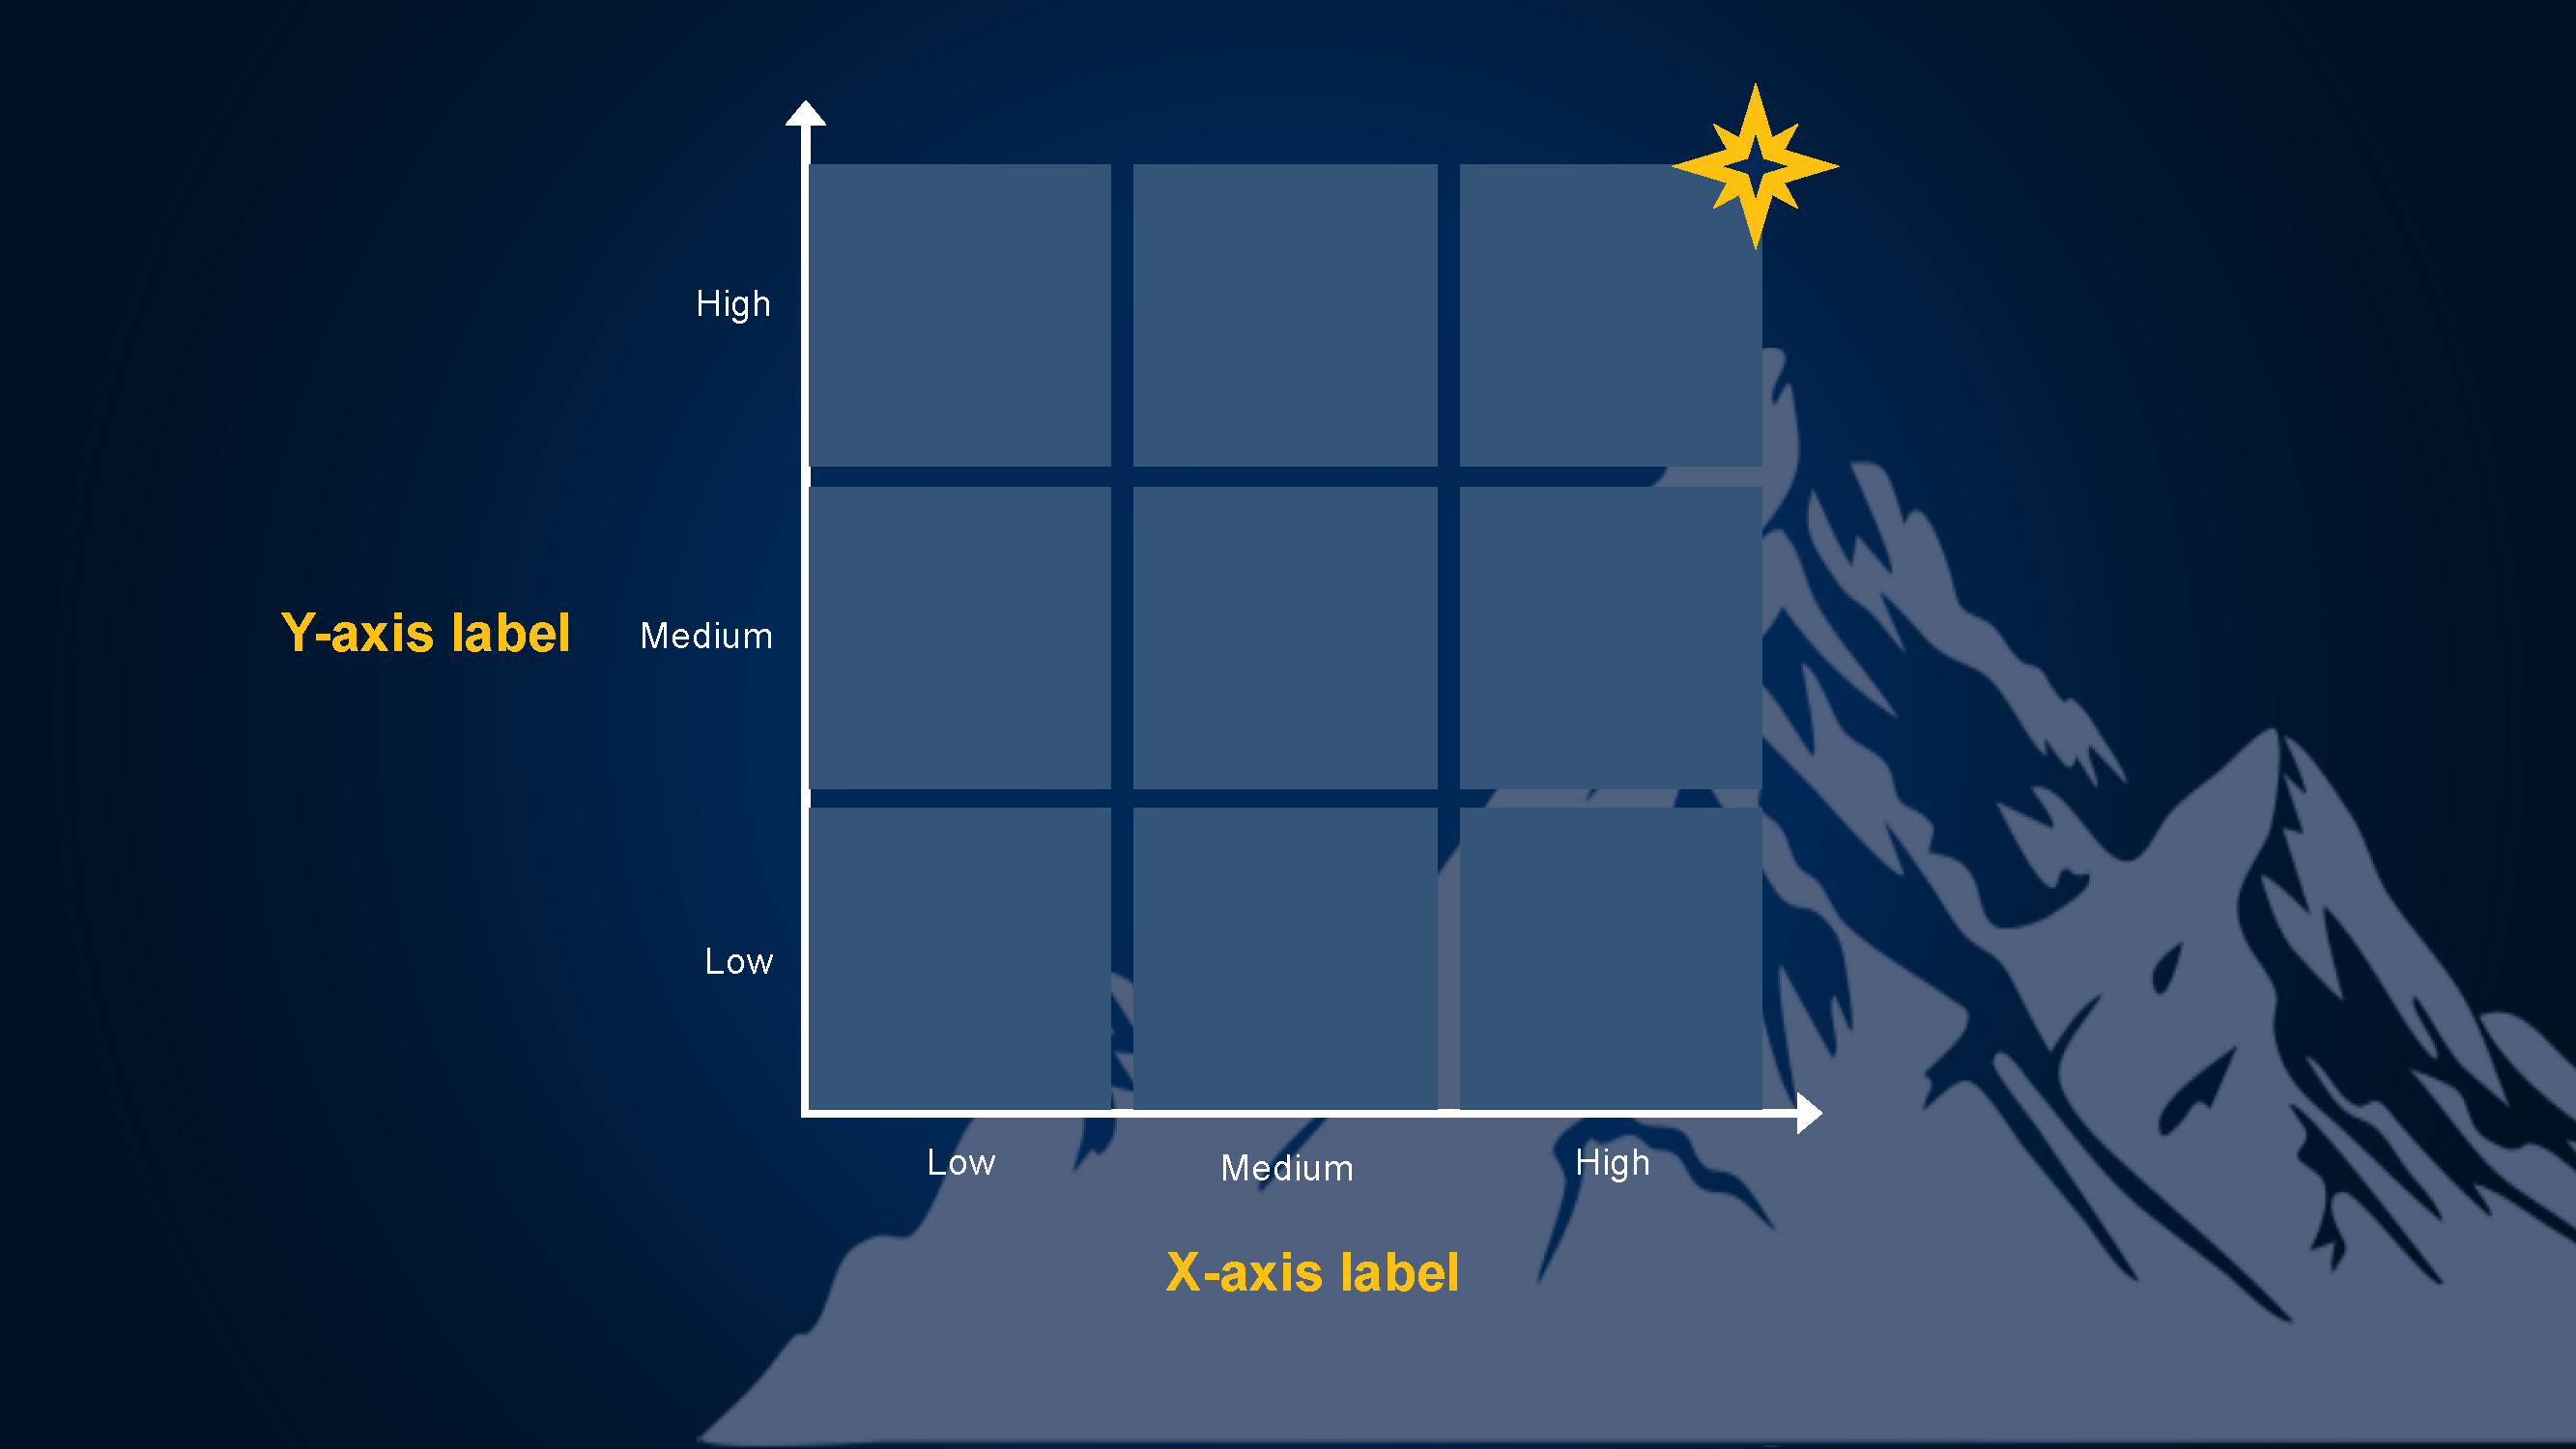
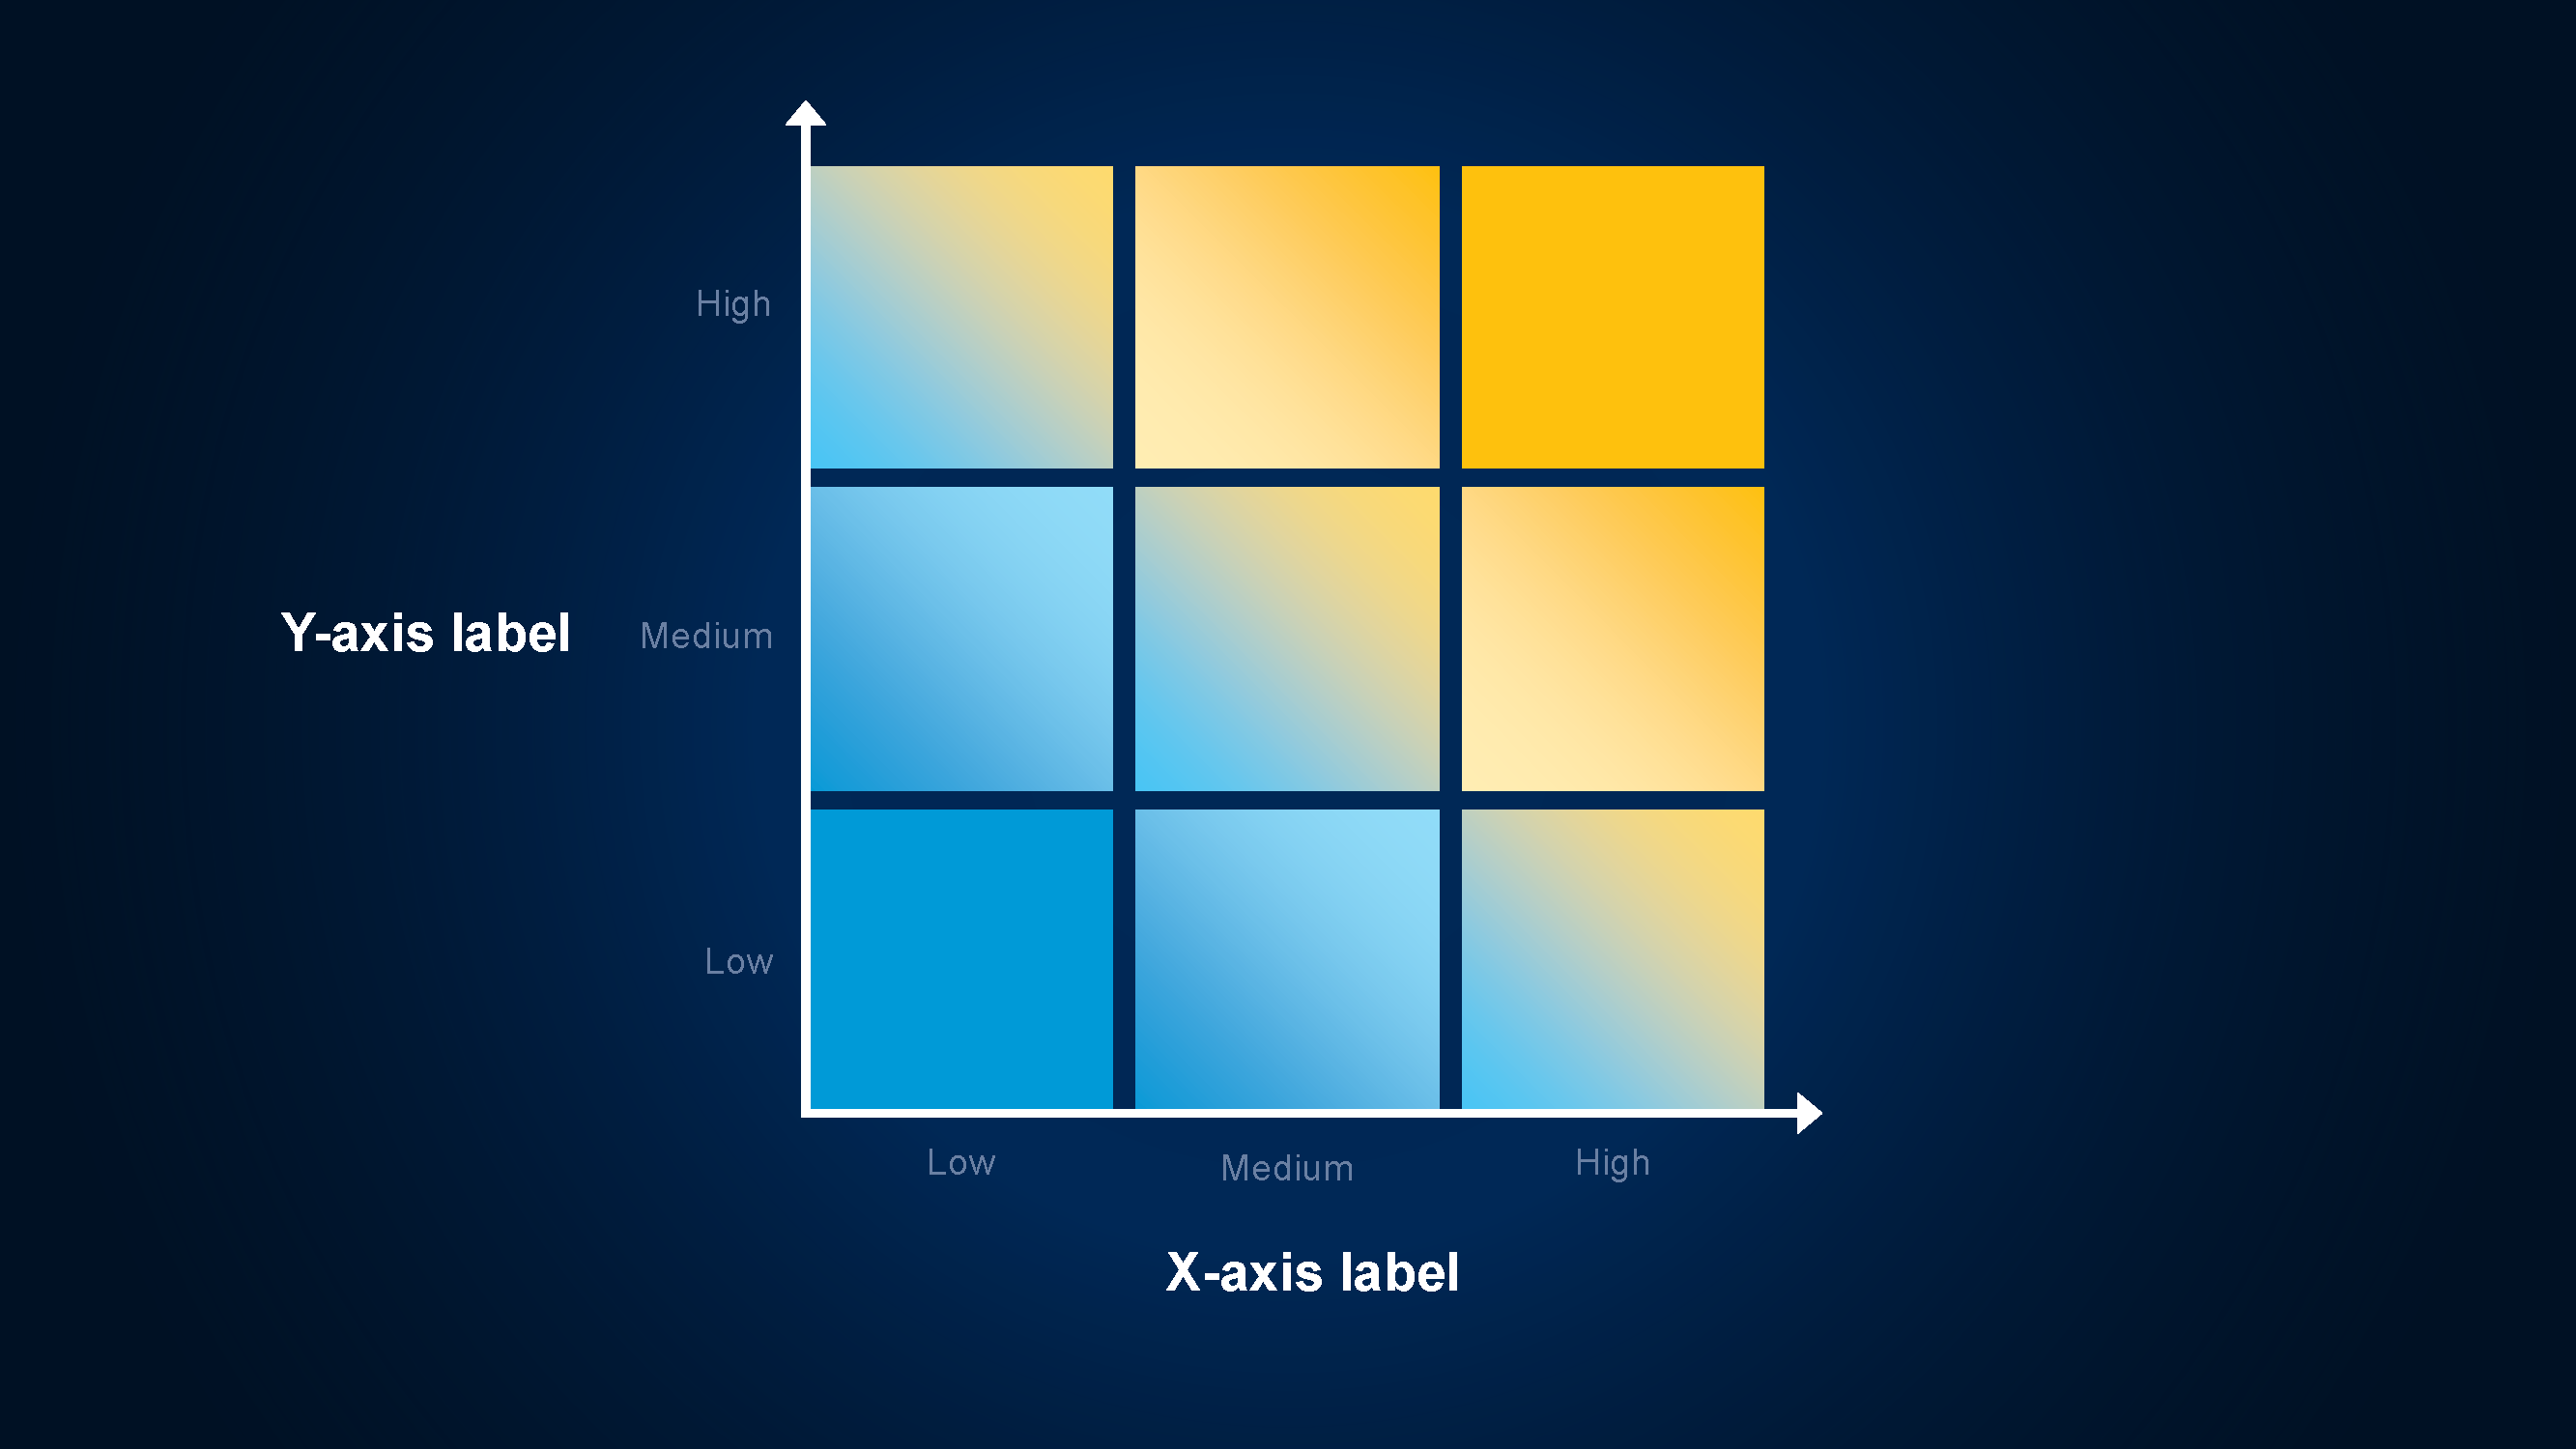
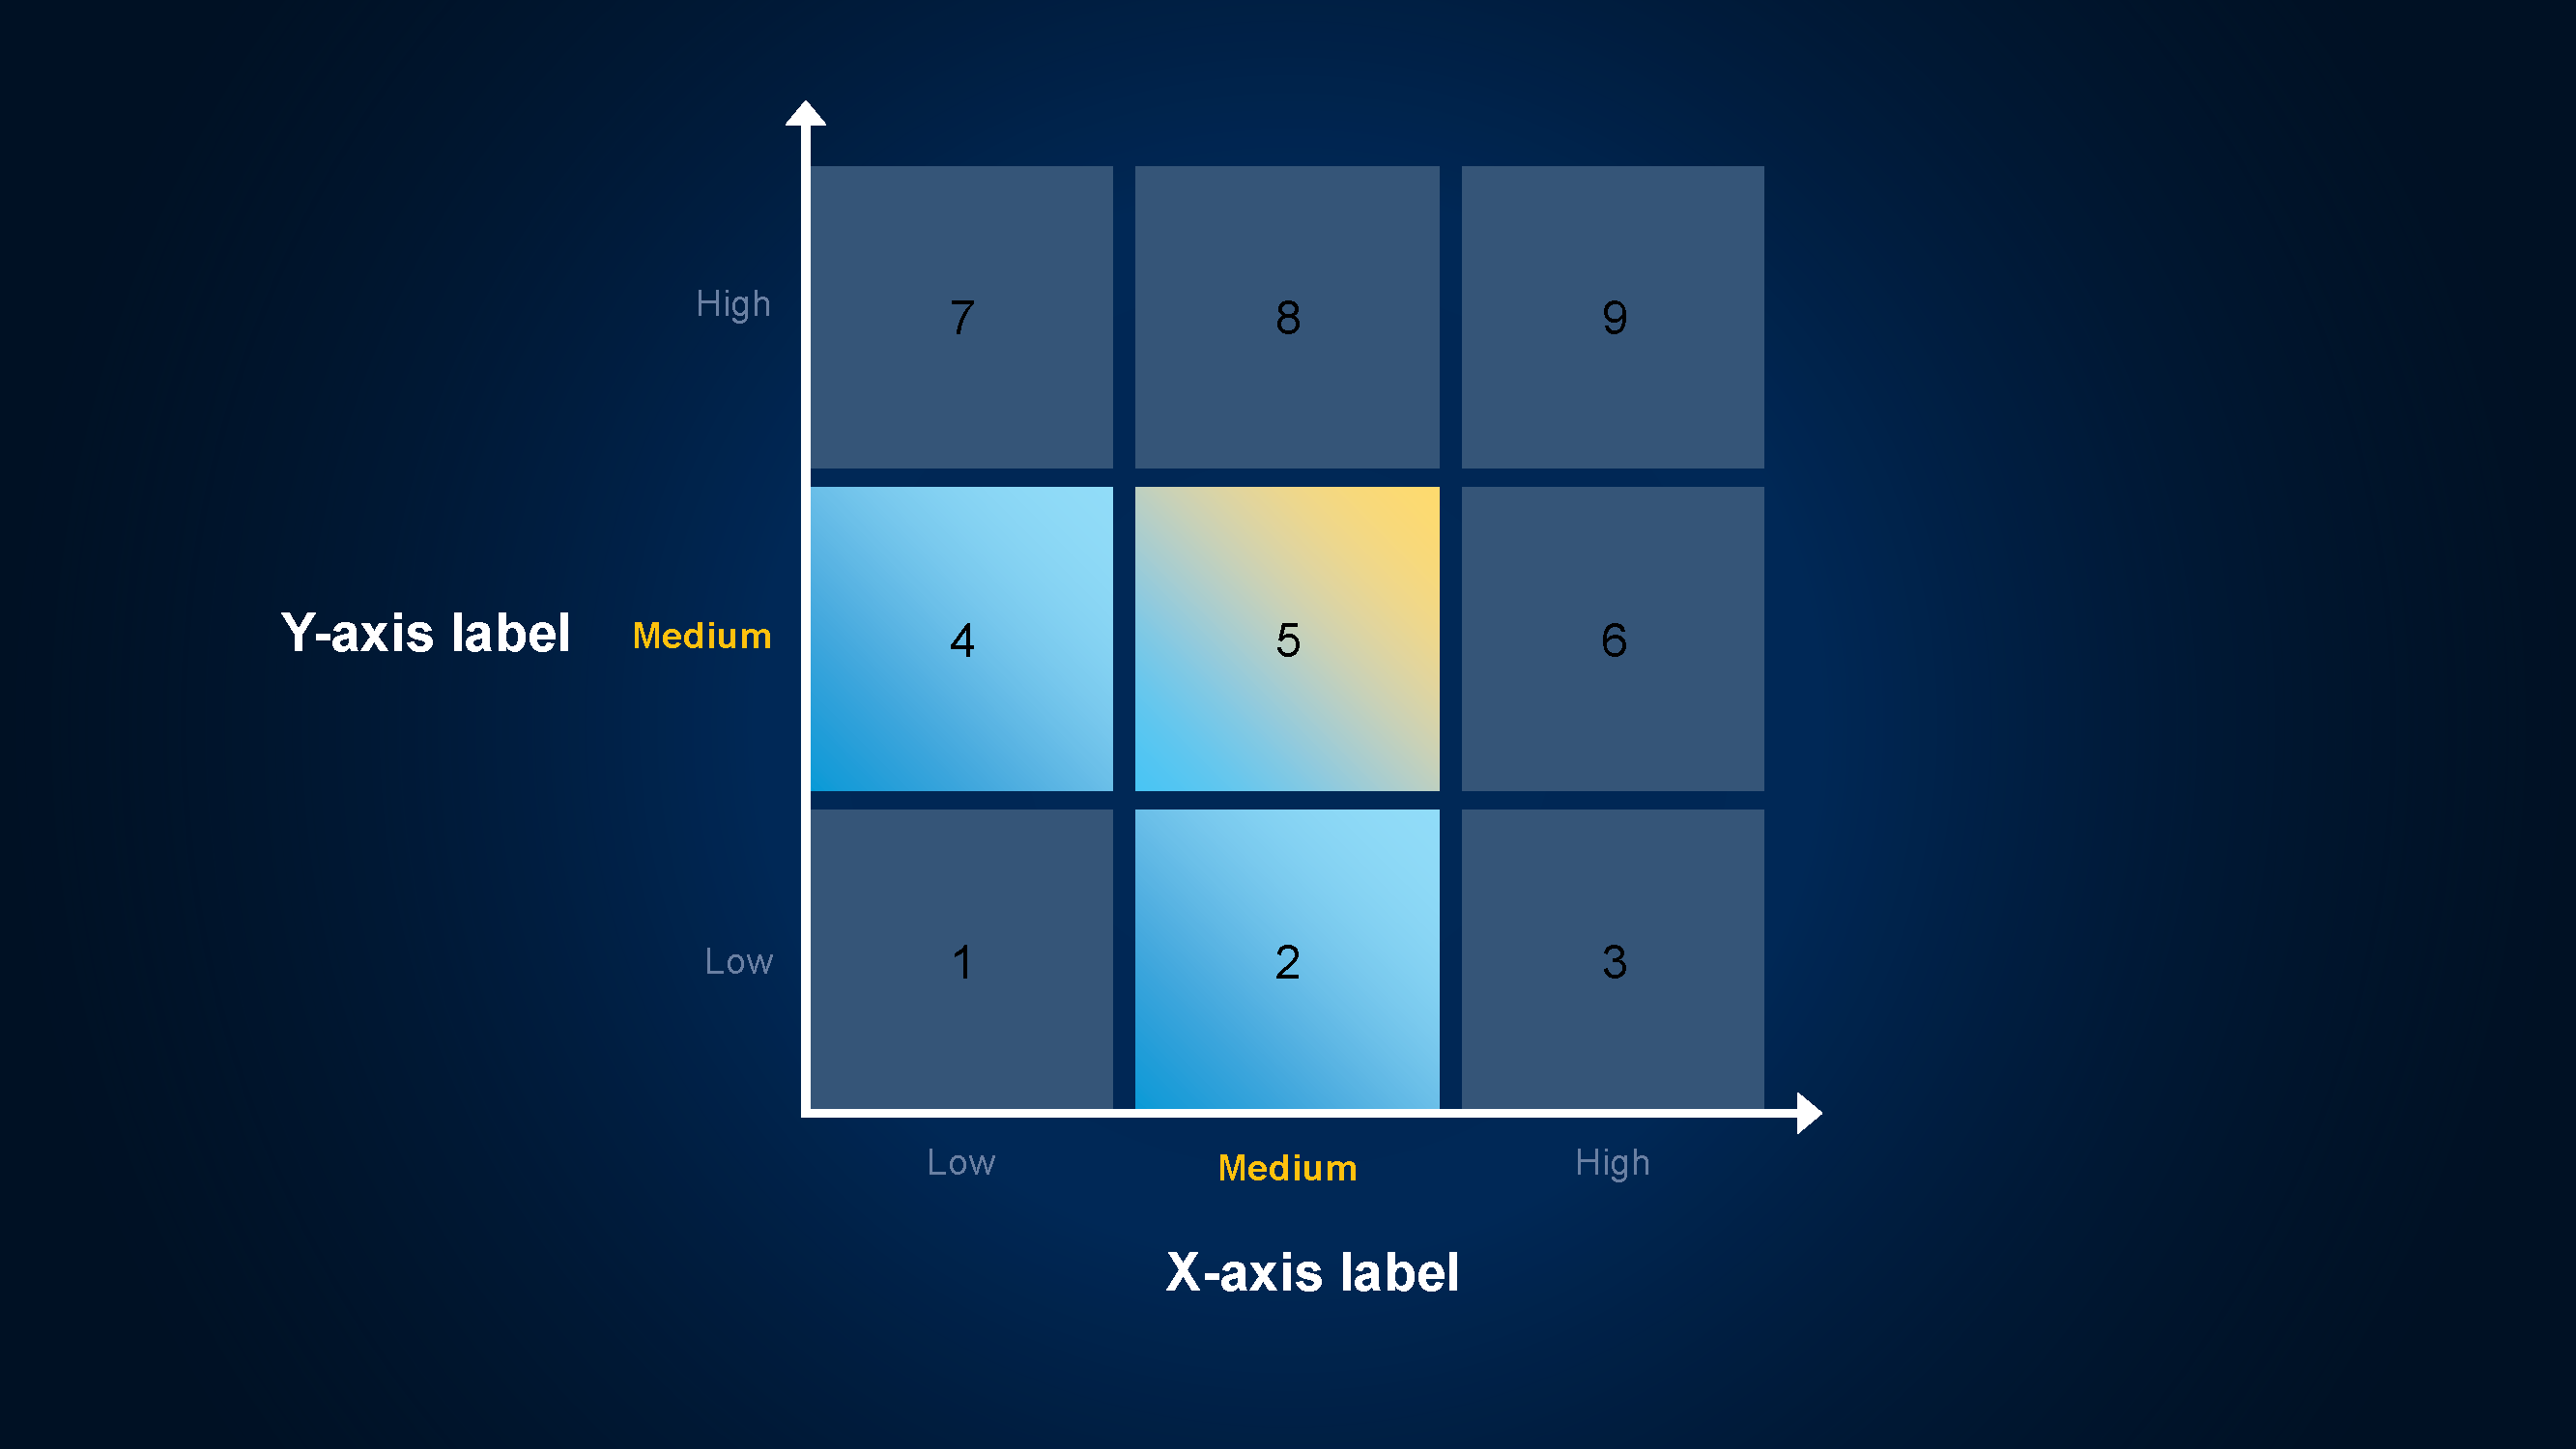
Patterns Tool
︎︎︎Gartner
The analyst wanted to visually show a smoother transition instead of blocks/ cells, and wanted to highlight “Aptent metus pulvinar.” The difference in size of the dots intuitively show what was more common.

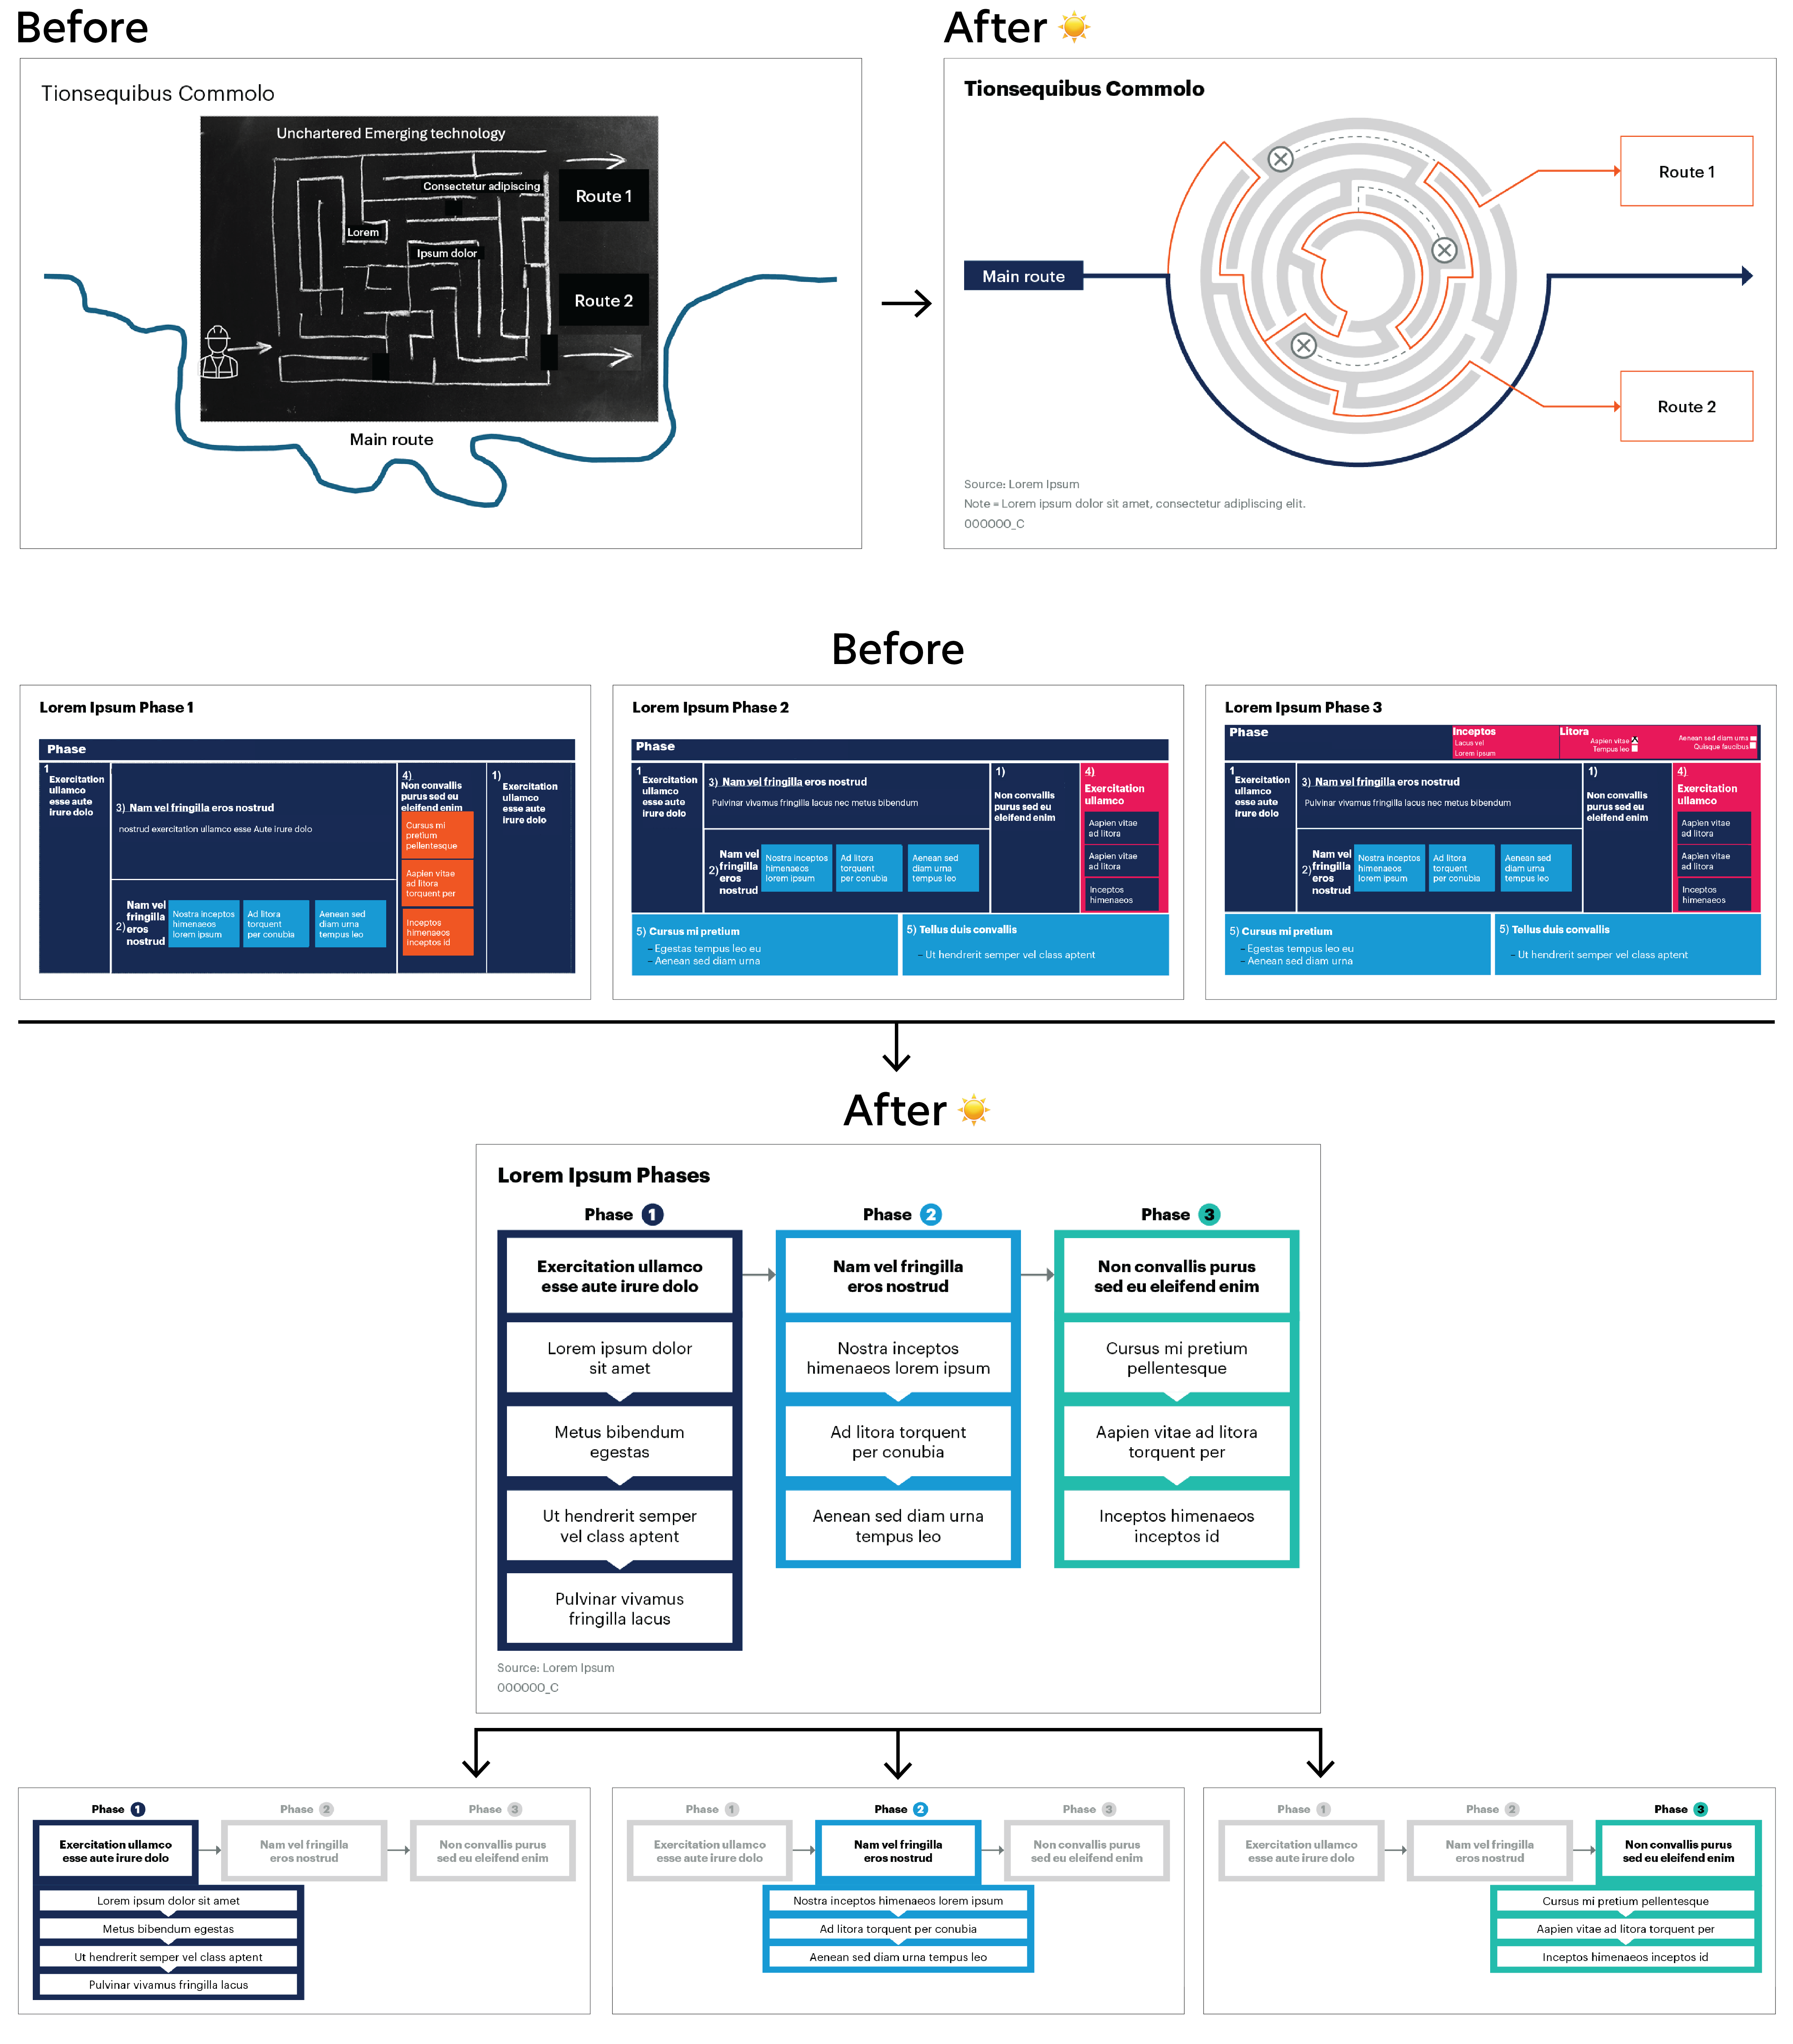
Roadmap Phases
︎︎︎ Gartner
Maze graphic: The analyst wanted to show that while most companies think about an innovative route to get out of the labryinth, there aretraditional routes that are important and should be considered as well. This was visually achieved by using color and lineweight.
Phases graphic: The phases were continuous, but each phase had different steps. To avoid repetition, one main web graphic was created (available for download to the clients,) and the other 3 graphics were embedded into the article to organize the analyst’s content and show which phase the reader was at.
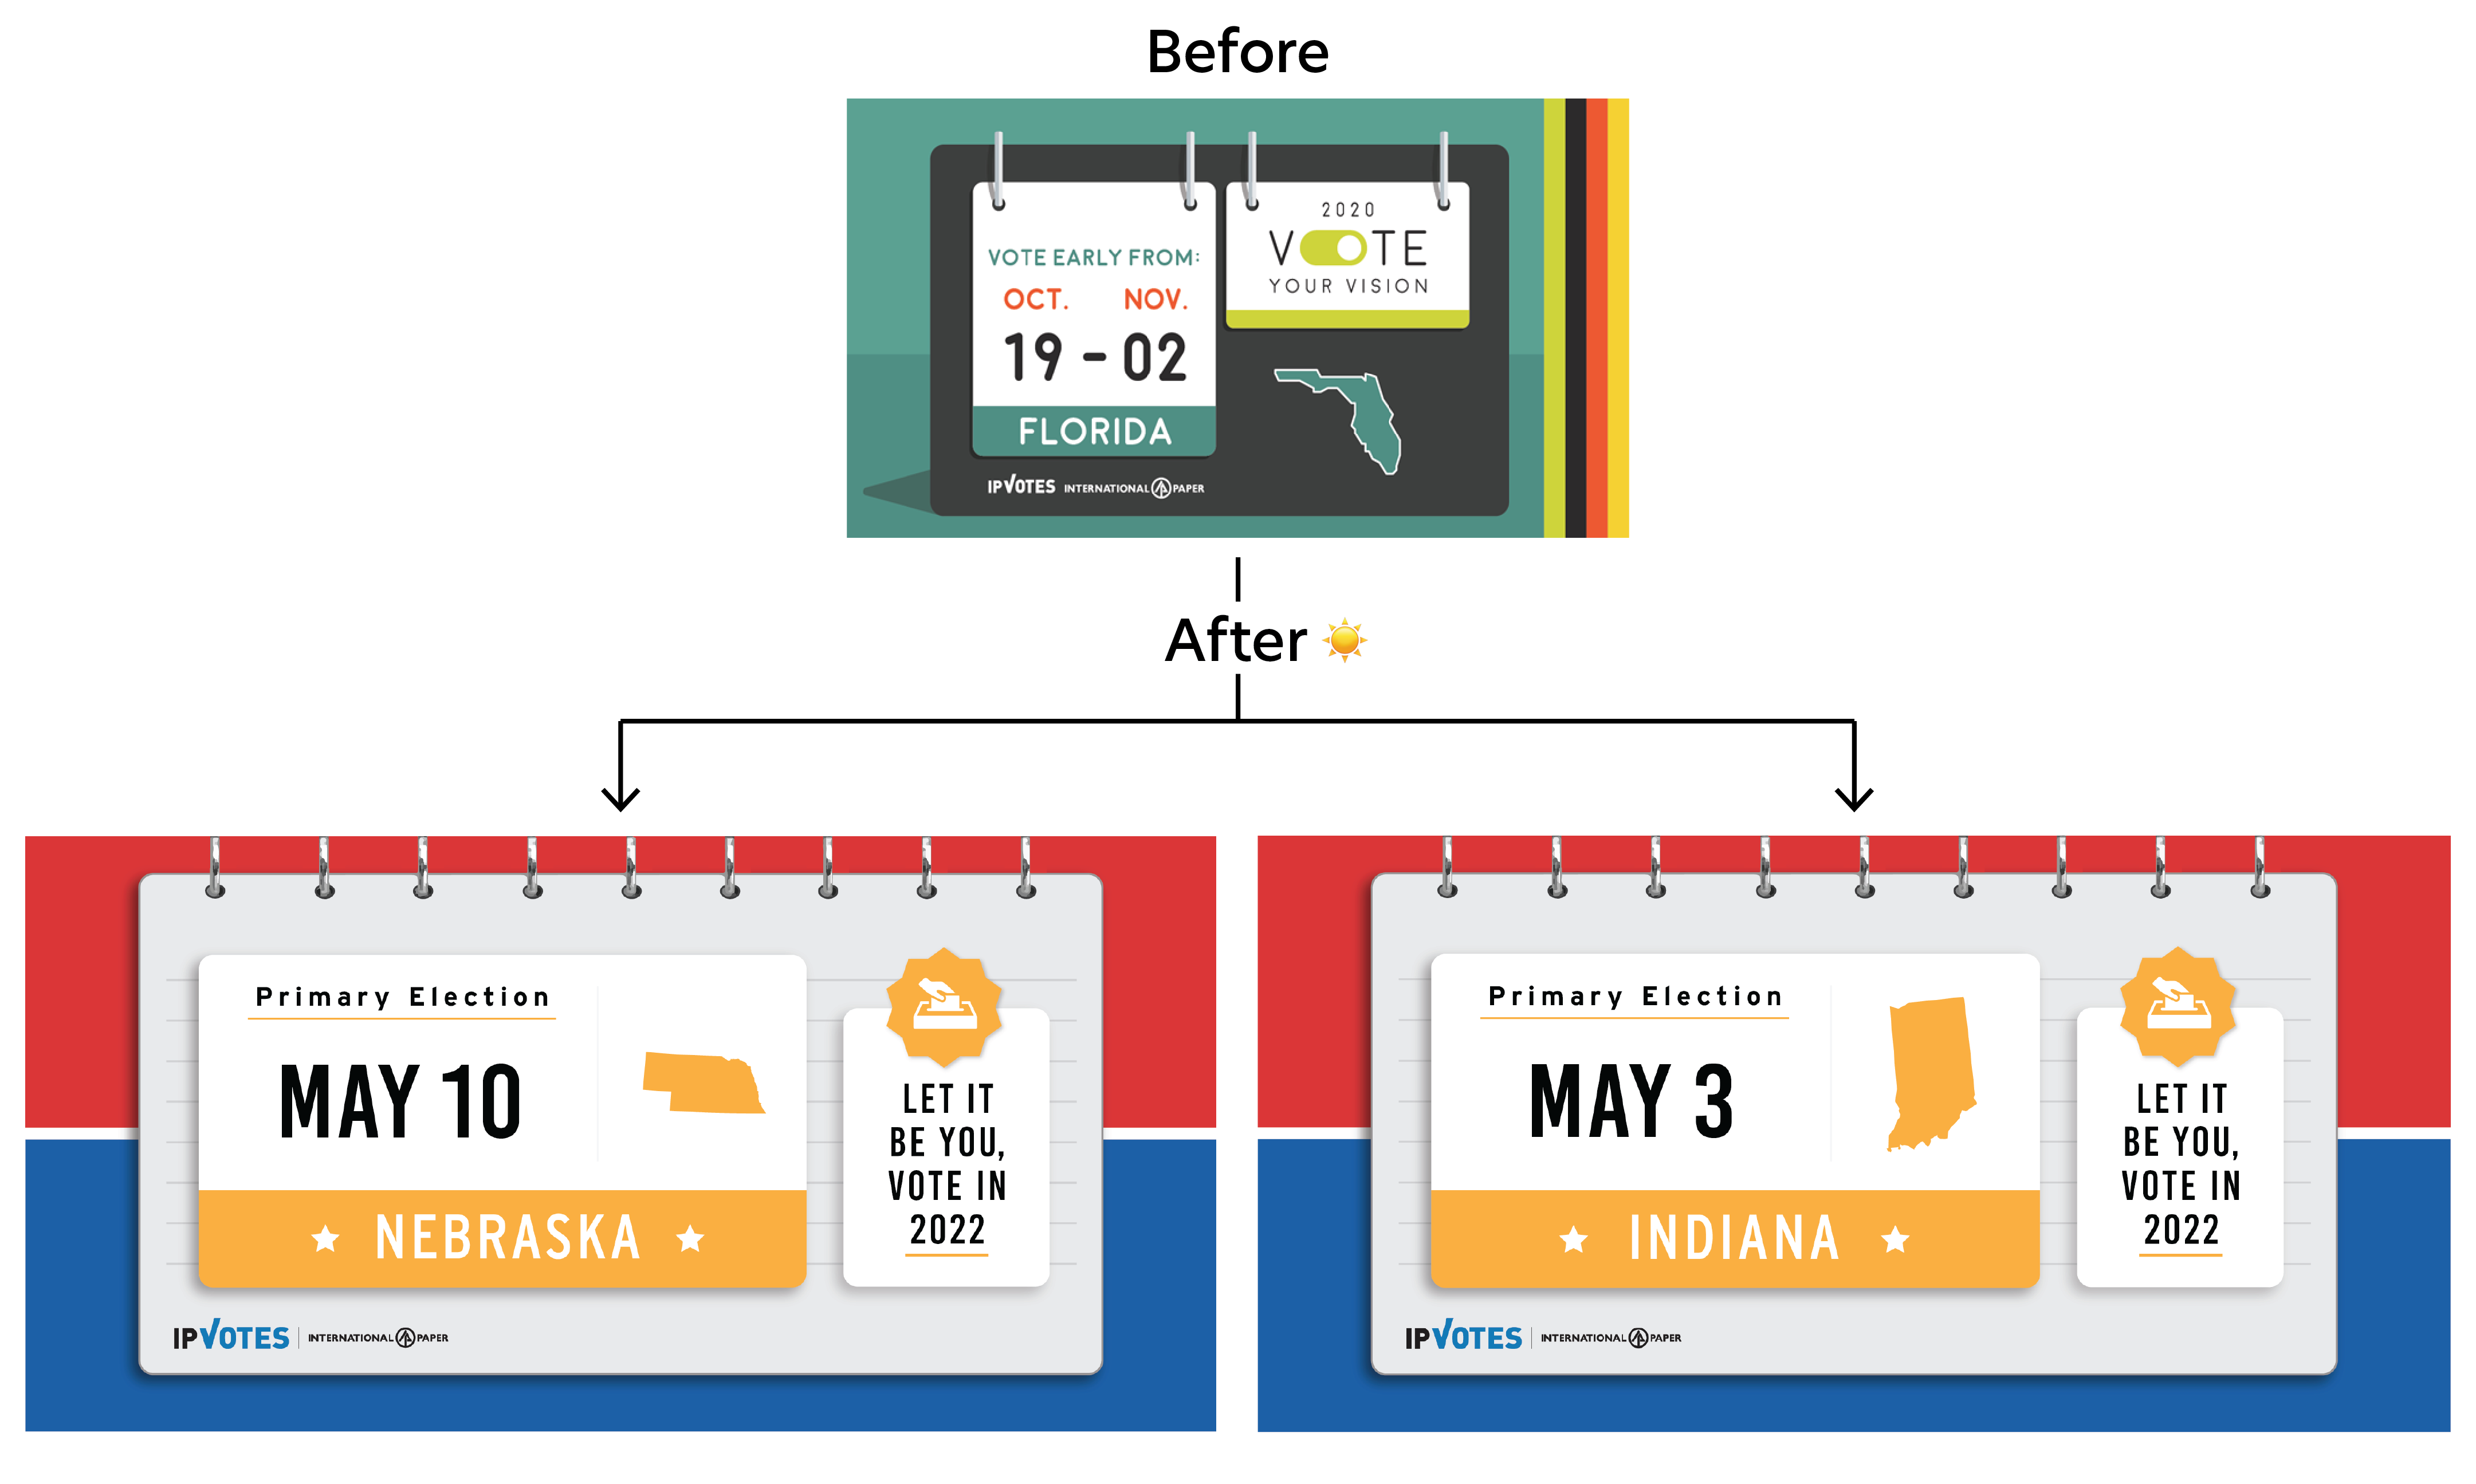
International Paper
︎︎︎National JournalRefreshed and updated social media posts for International Paper. Indiana and Nebraska are shown as examples, but other states that still had their primary election were also updated.
Product Marketing
︎︎︎National JournalVisualized some of National Journal’s digital products for the web and email newsletter.
Adding subtle motion/animations to small elements made the digital advertisements elevated and stand out.


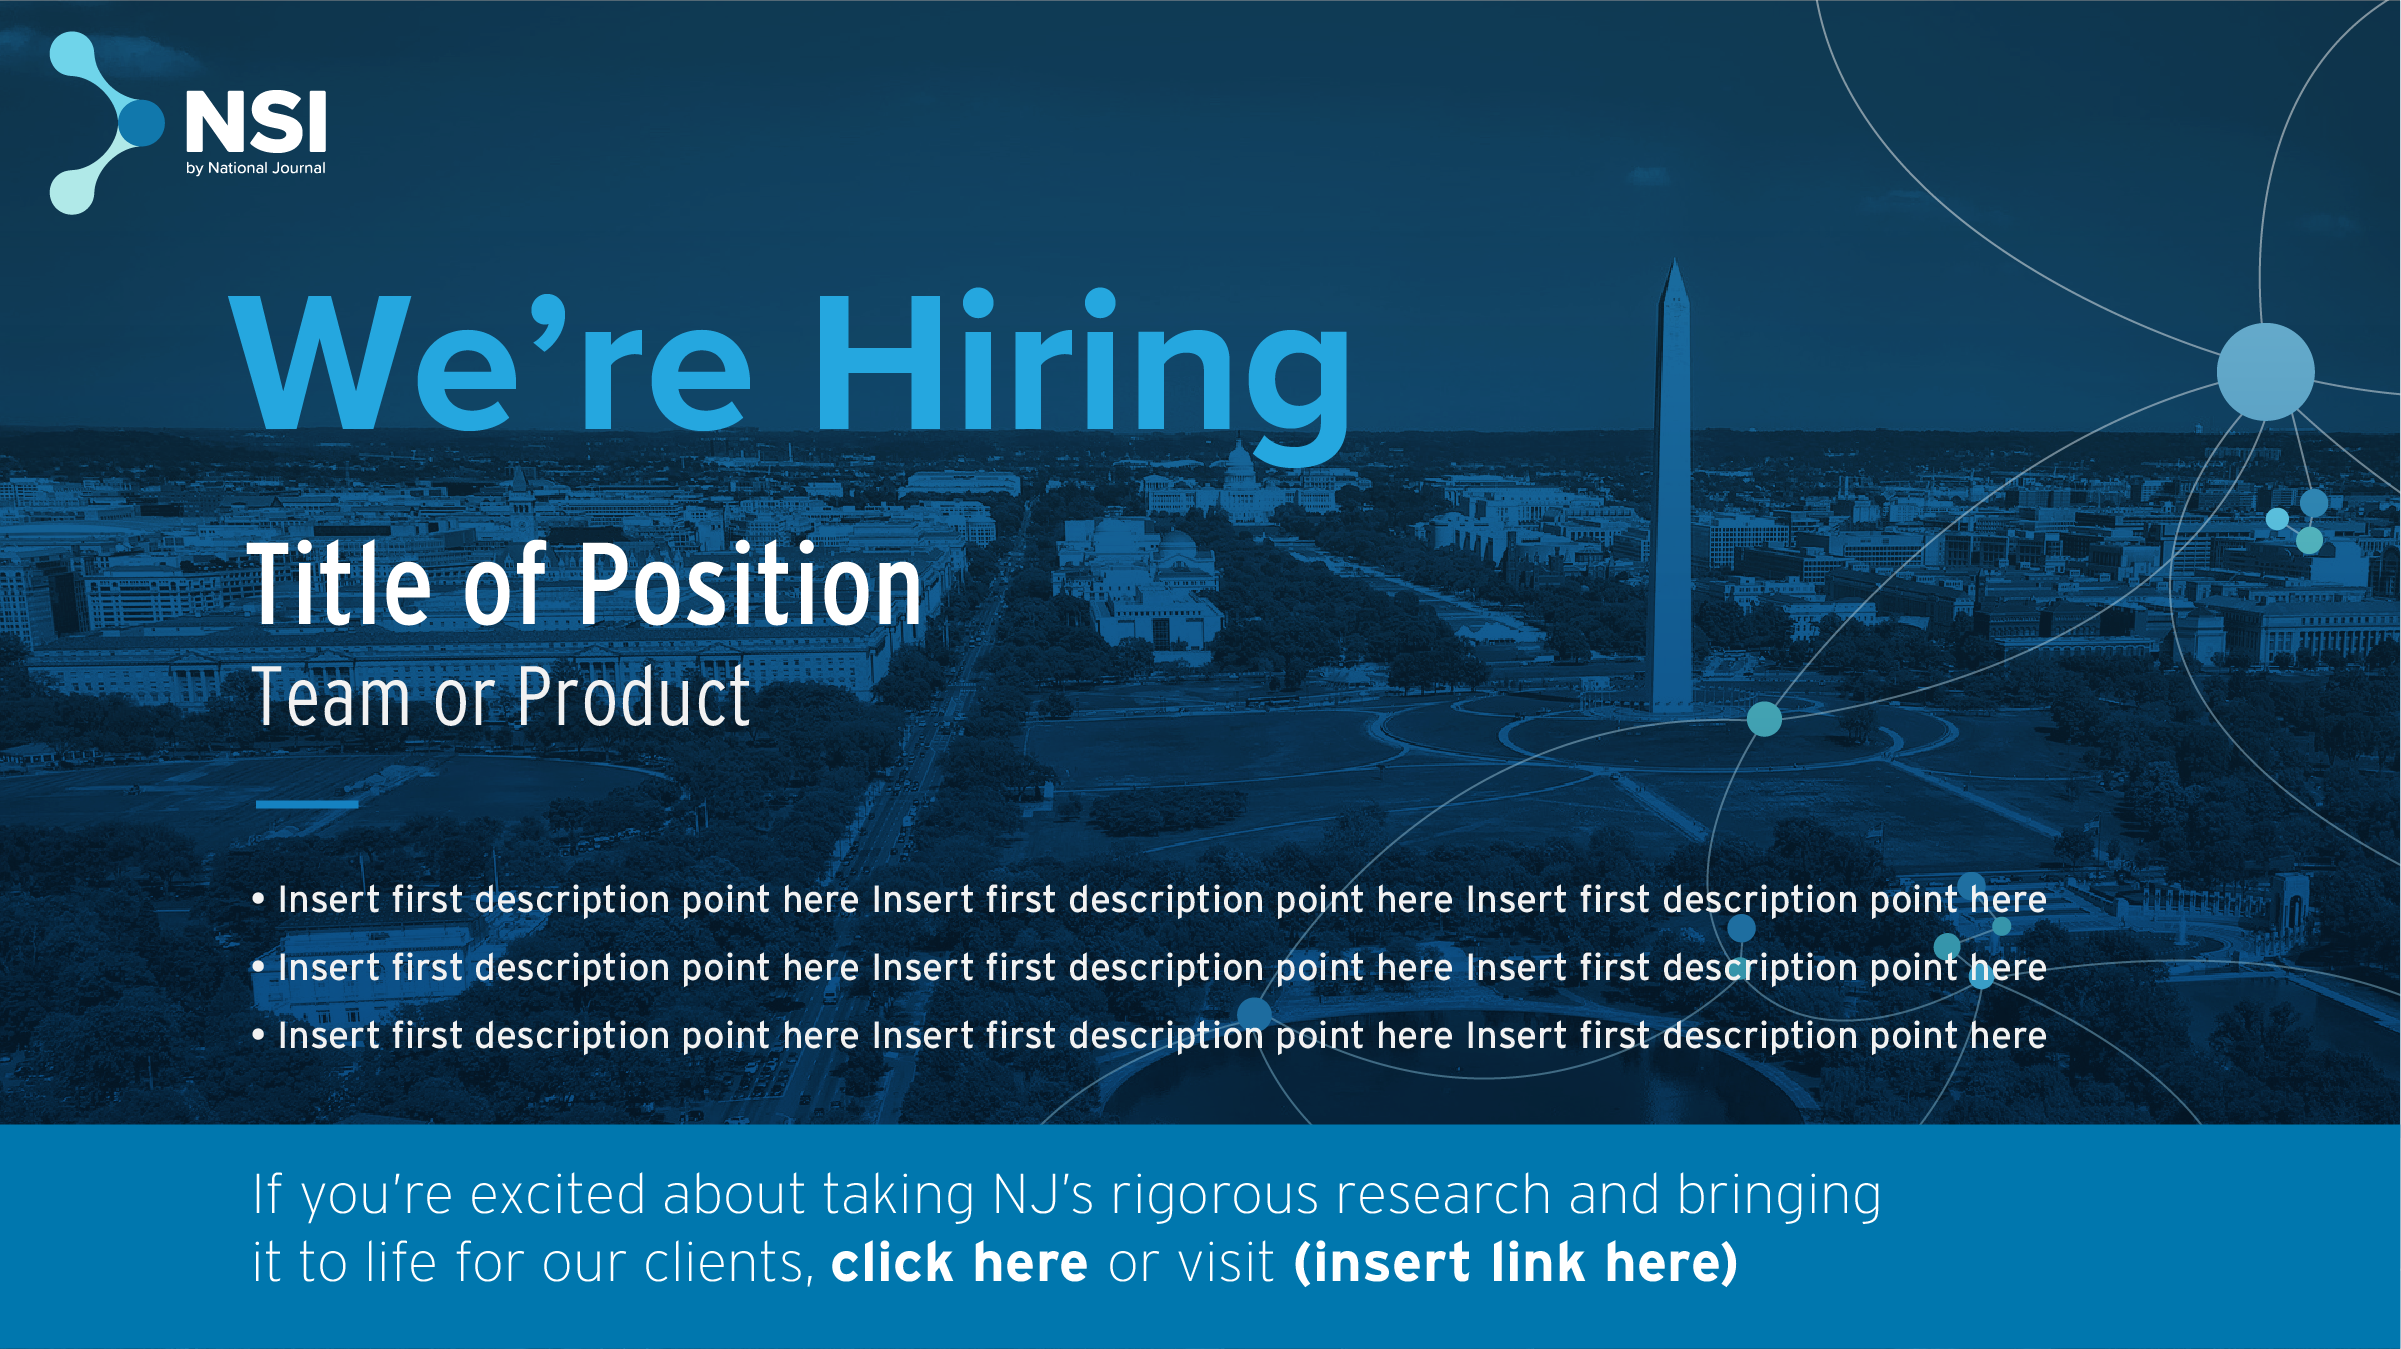
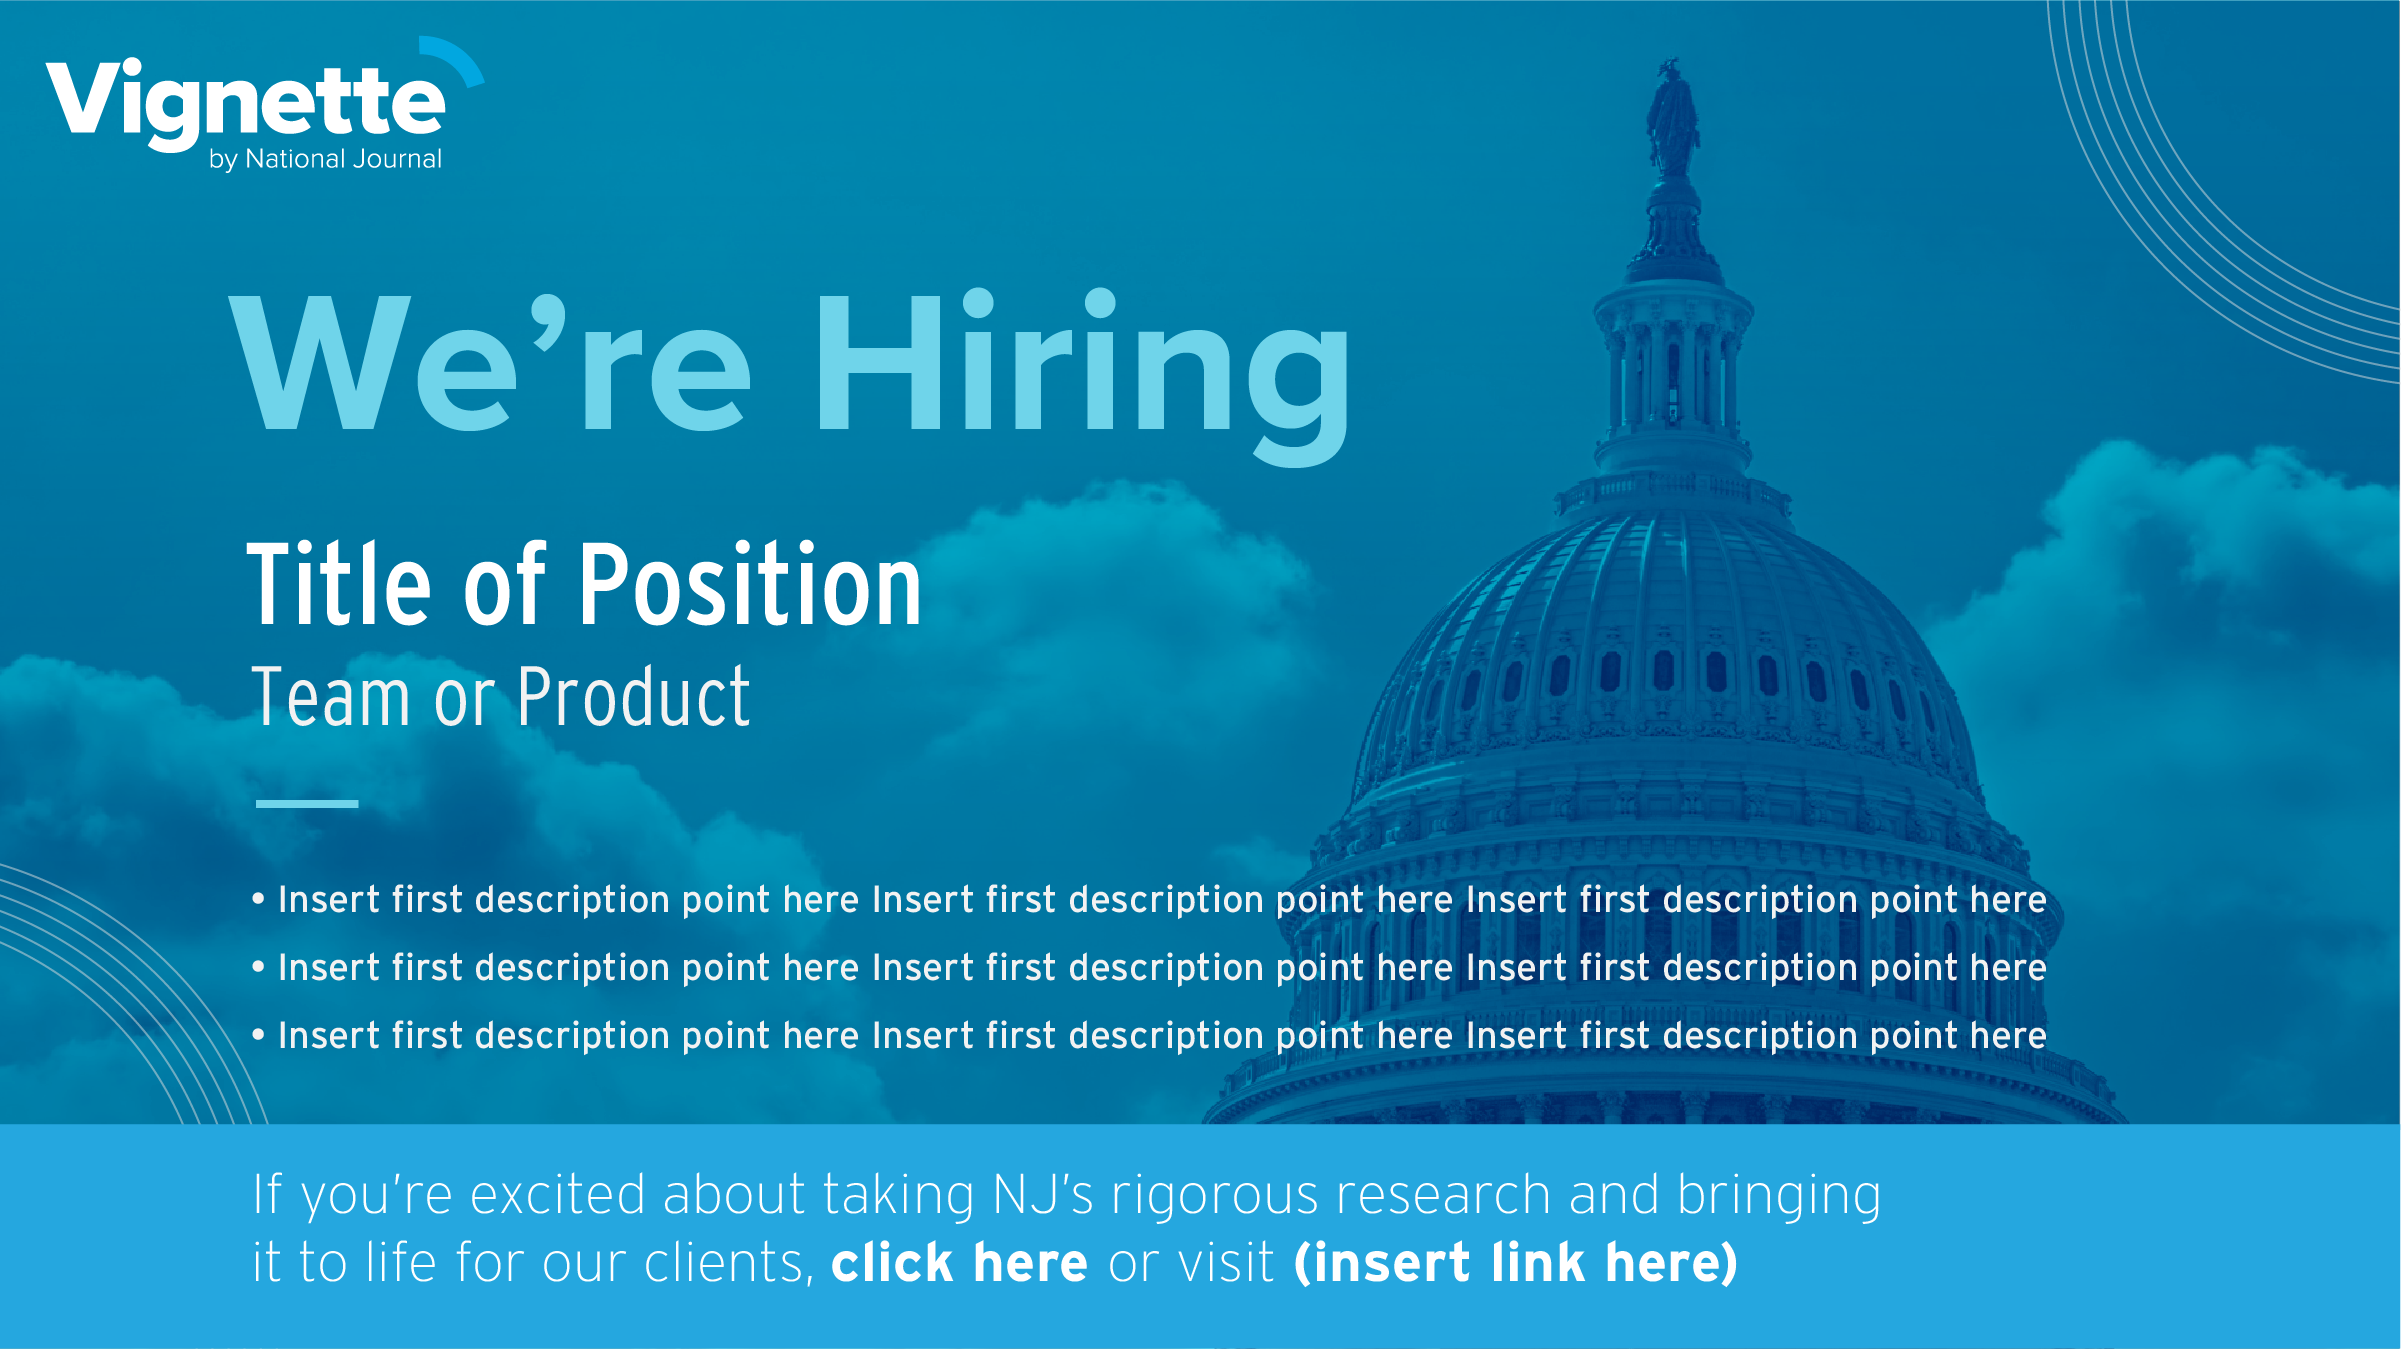
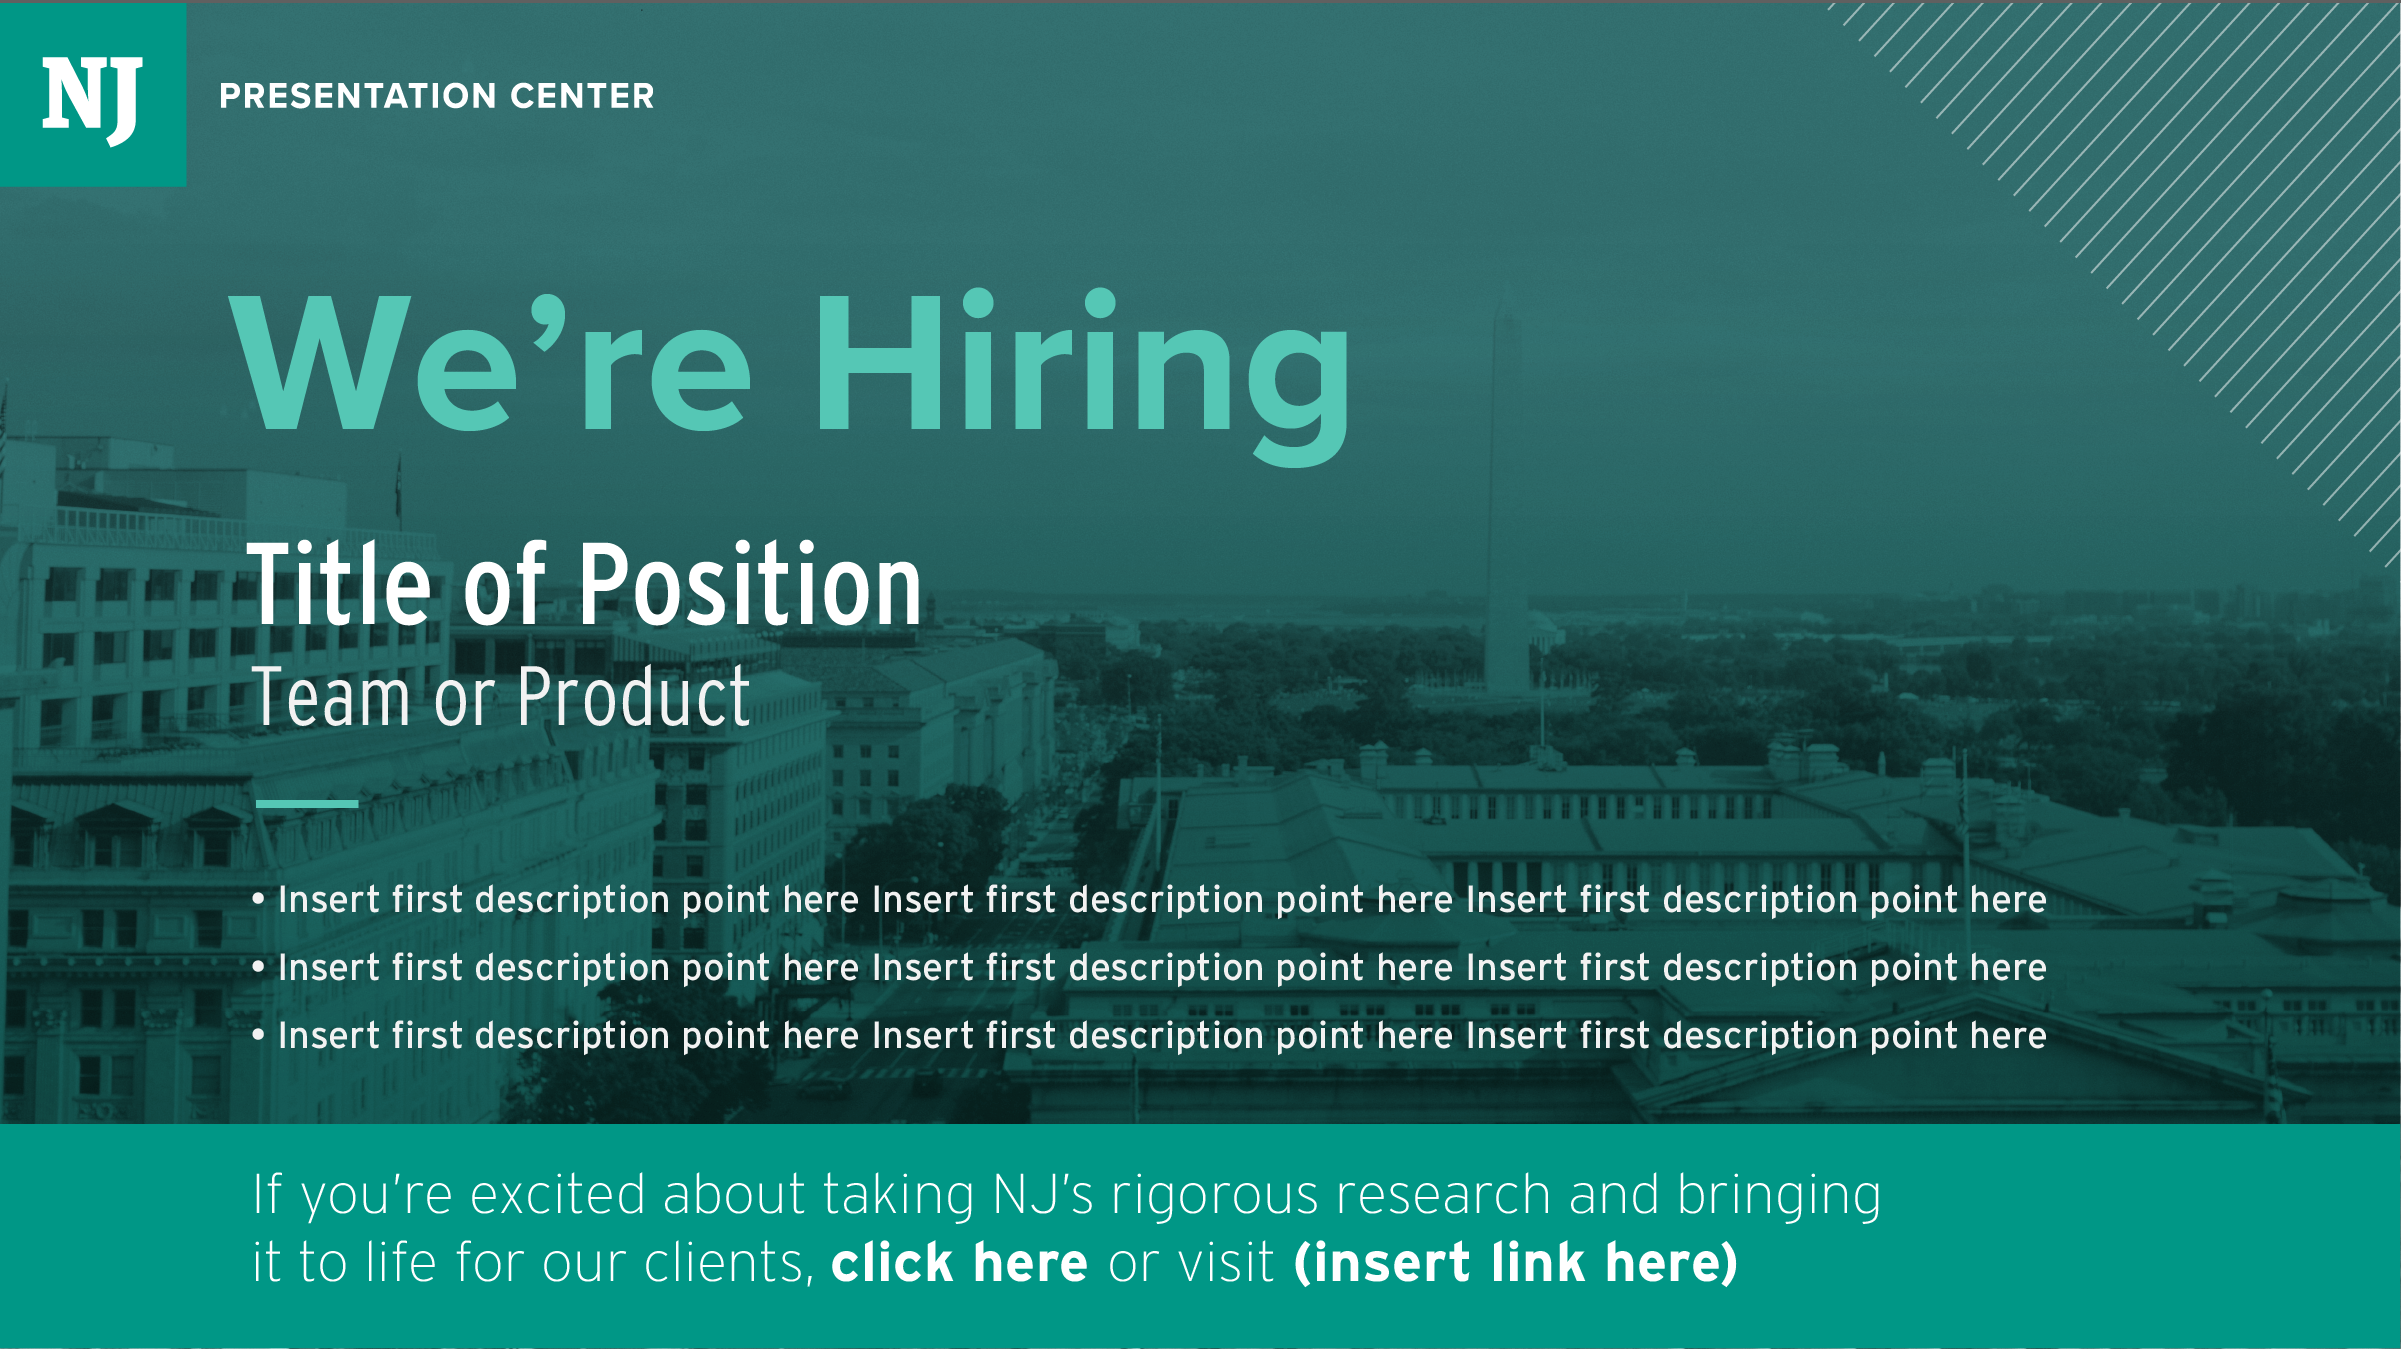
Hiring Templates
︎︎︎National JournalCreated new hiring templates for National Journal’s three focus branches: Presentation Center, Vignette, and NSI. Each match the color of the respective product, and all have consistent layout and type to maintain the overall look of National Journal.
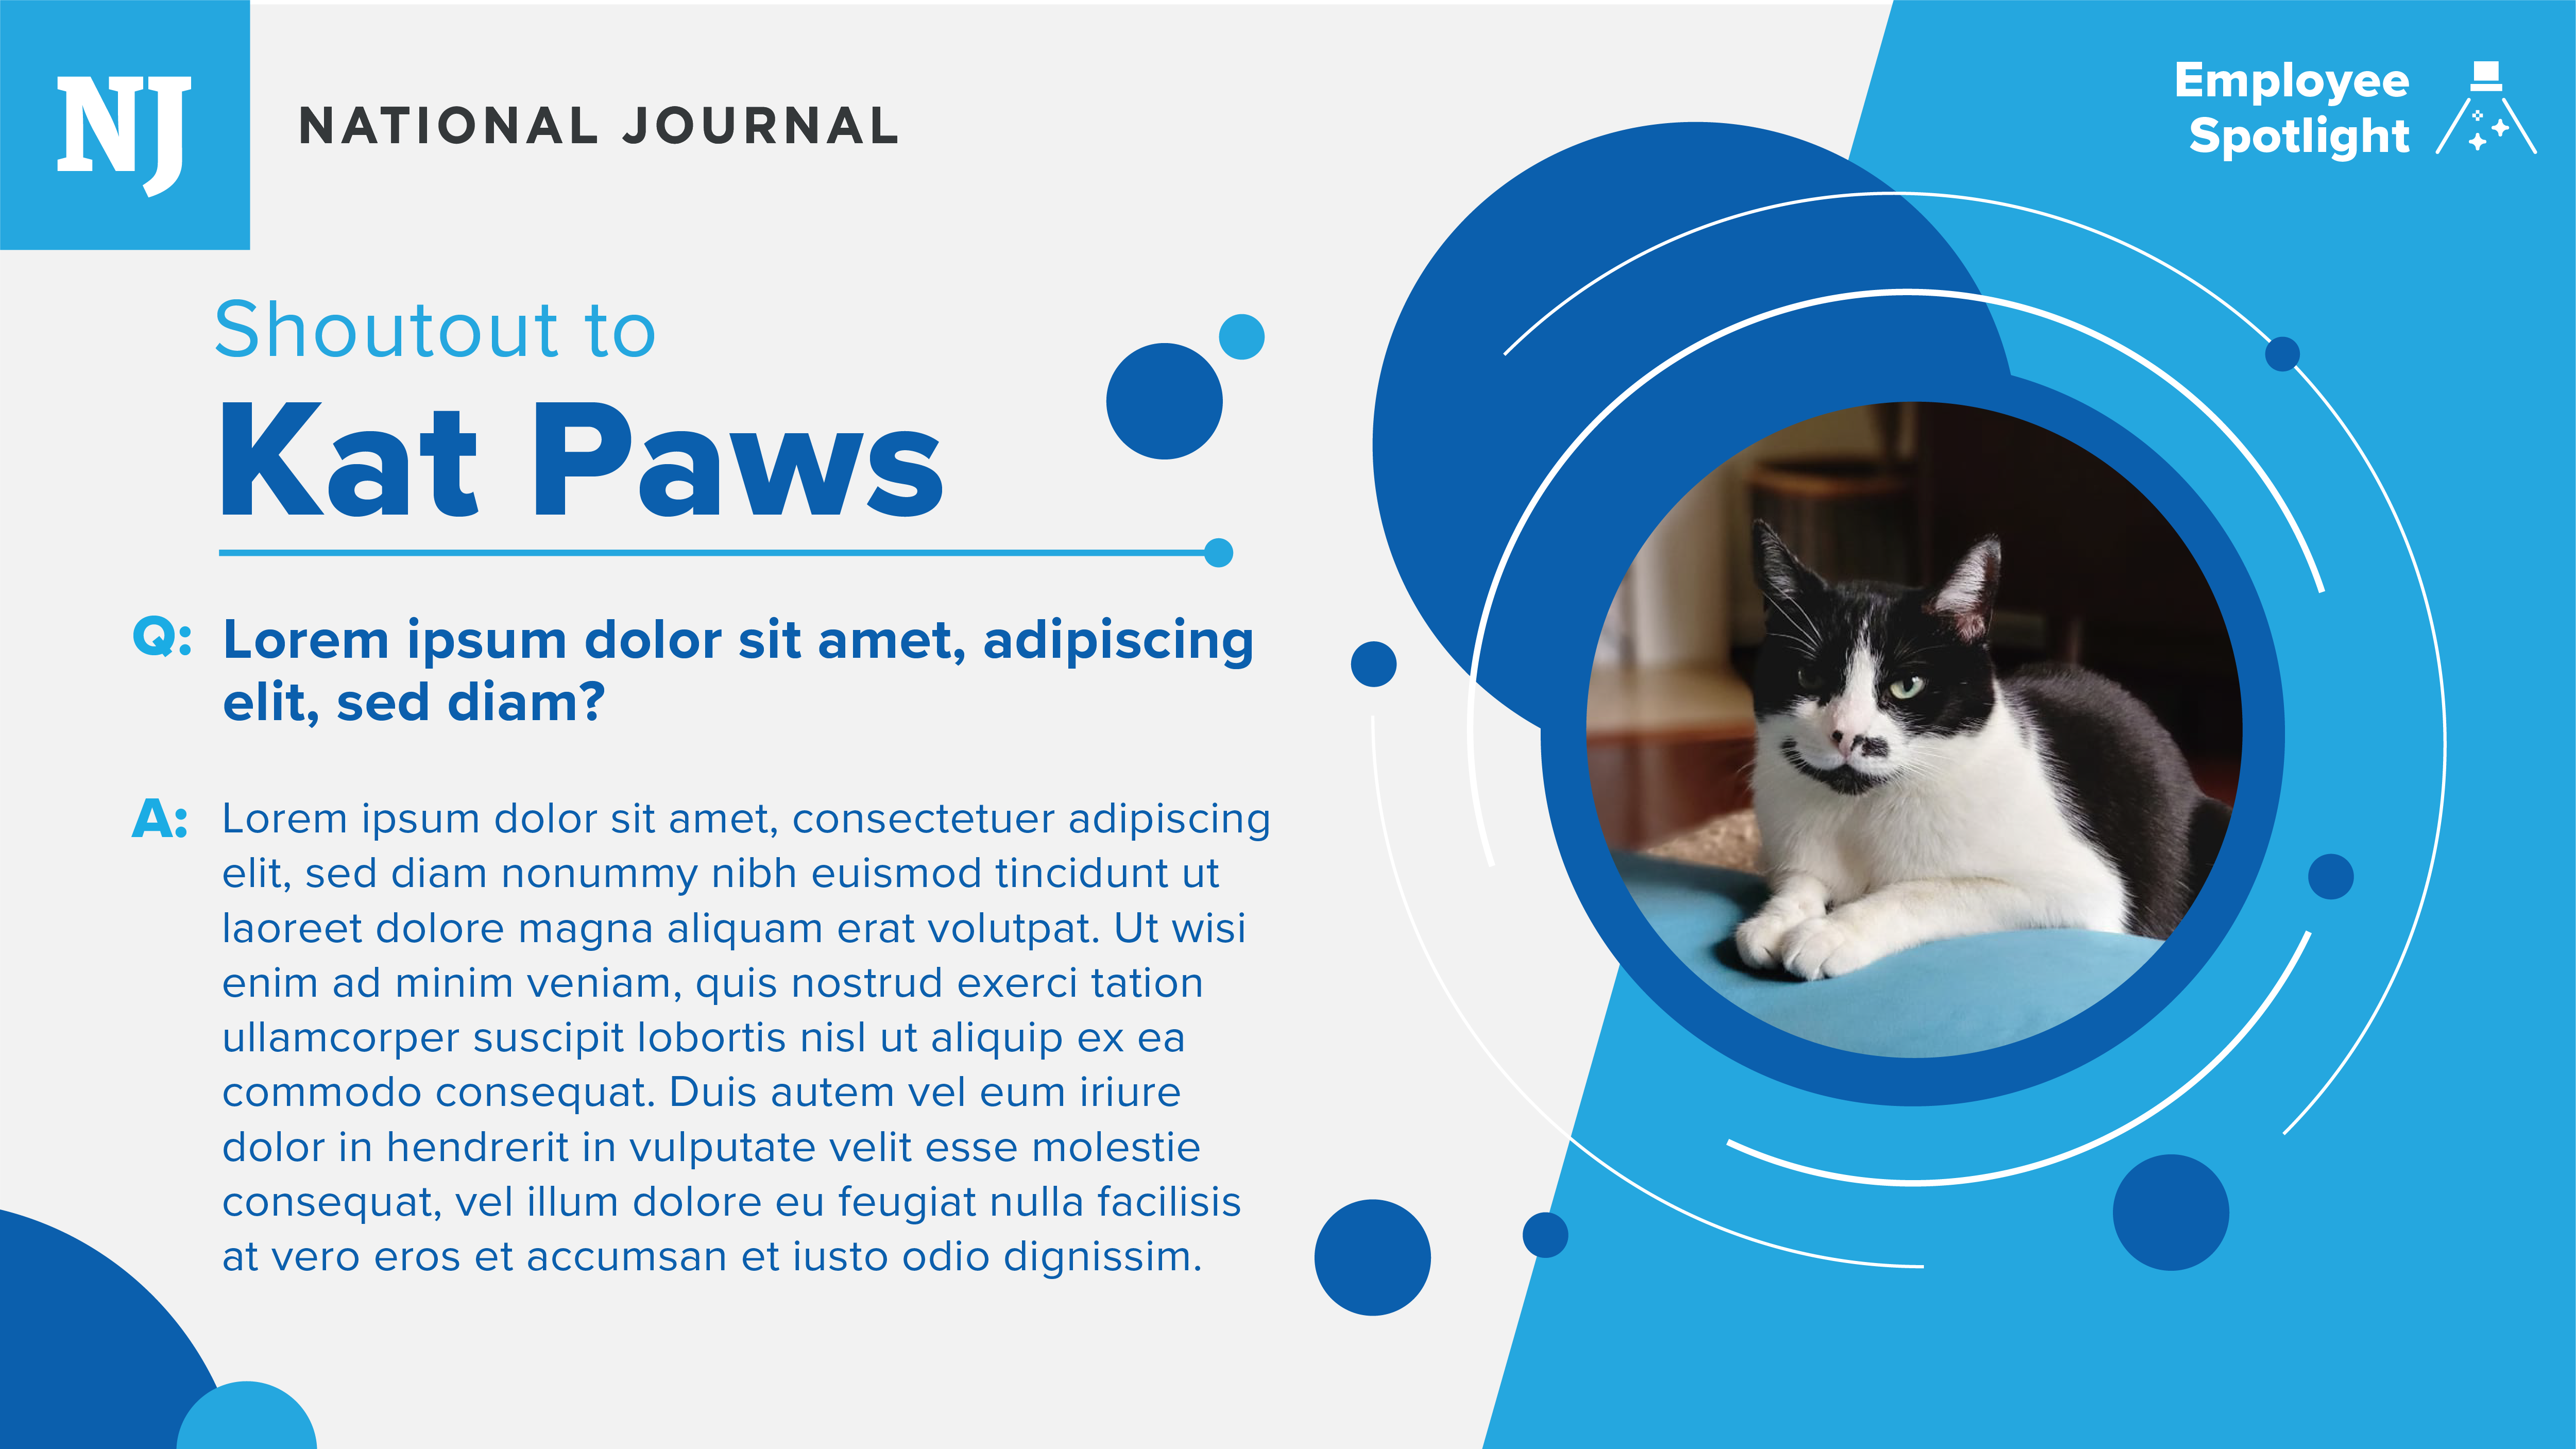
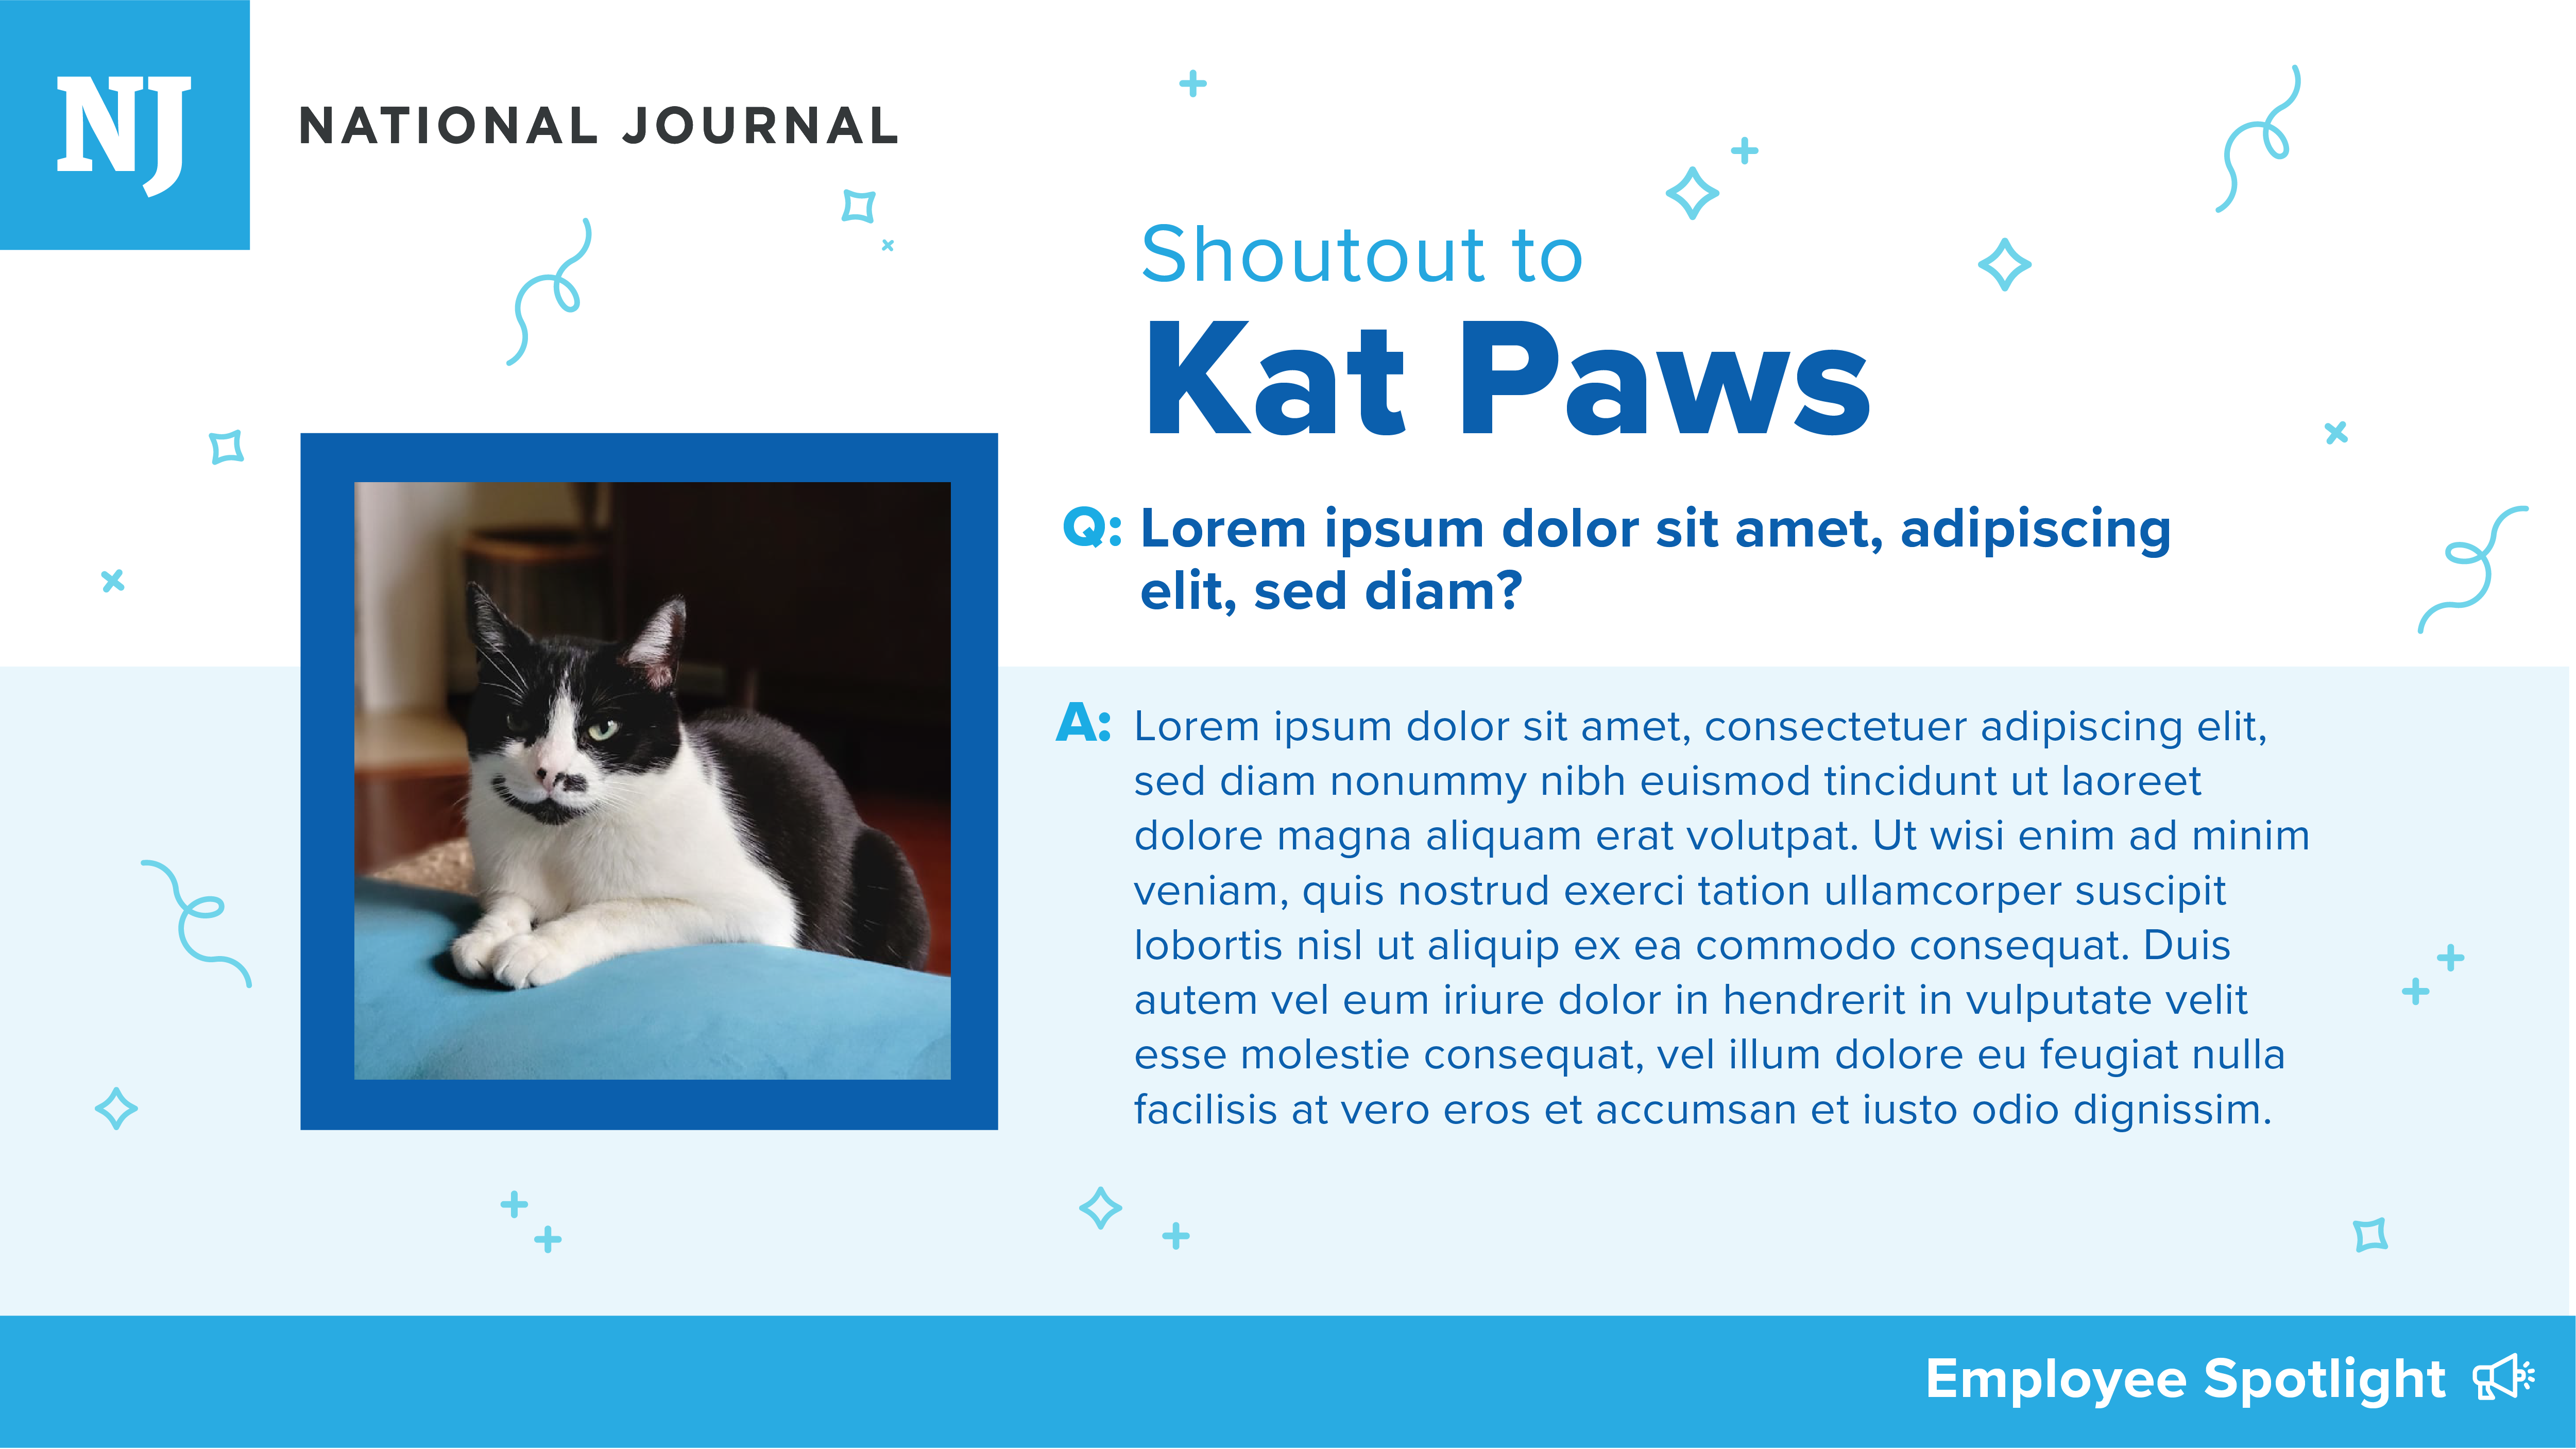
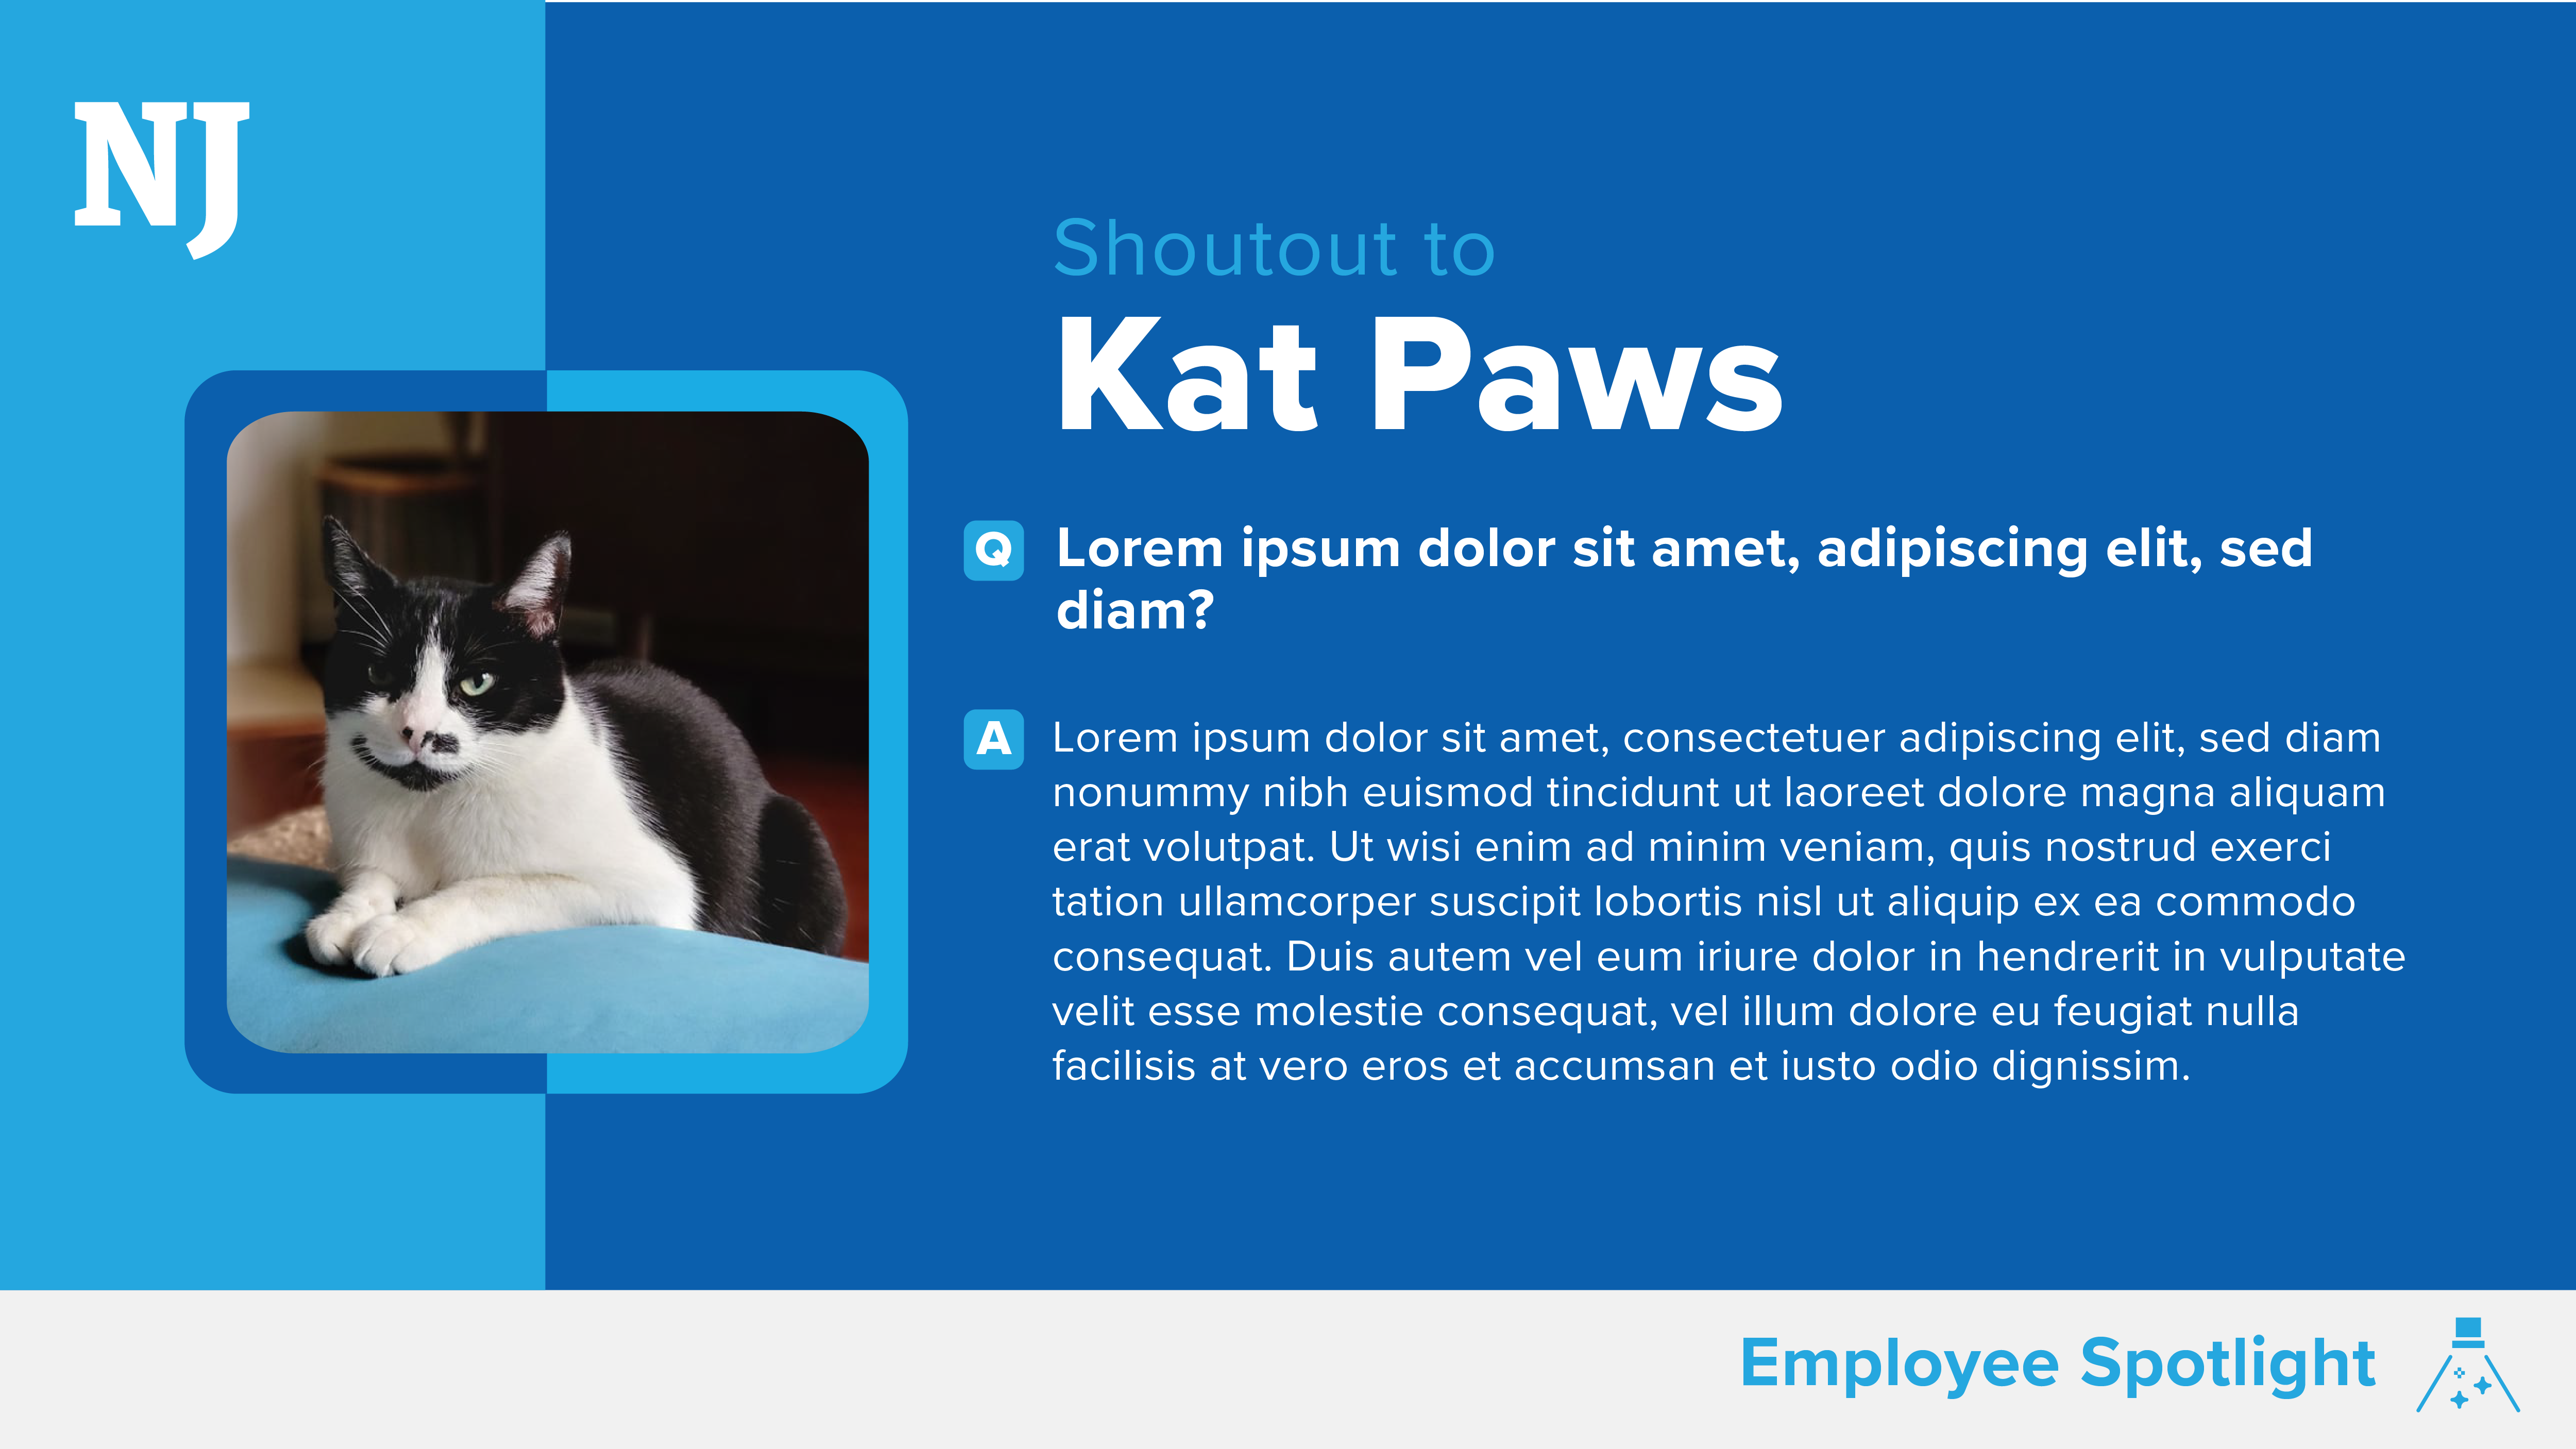
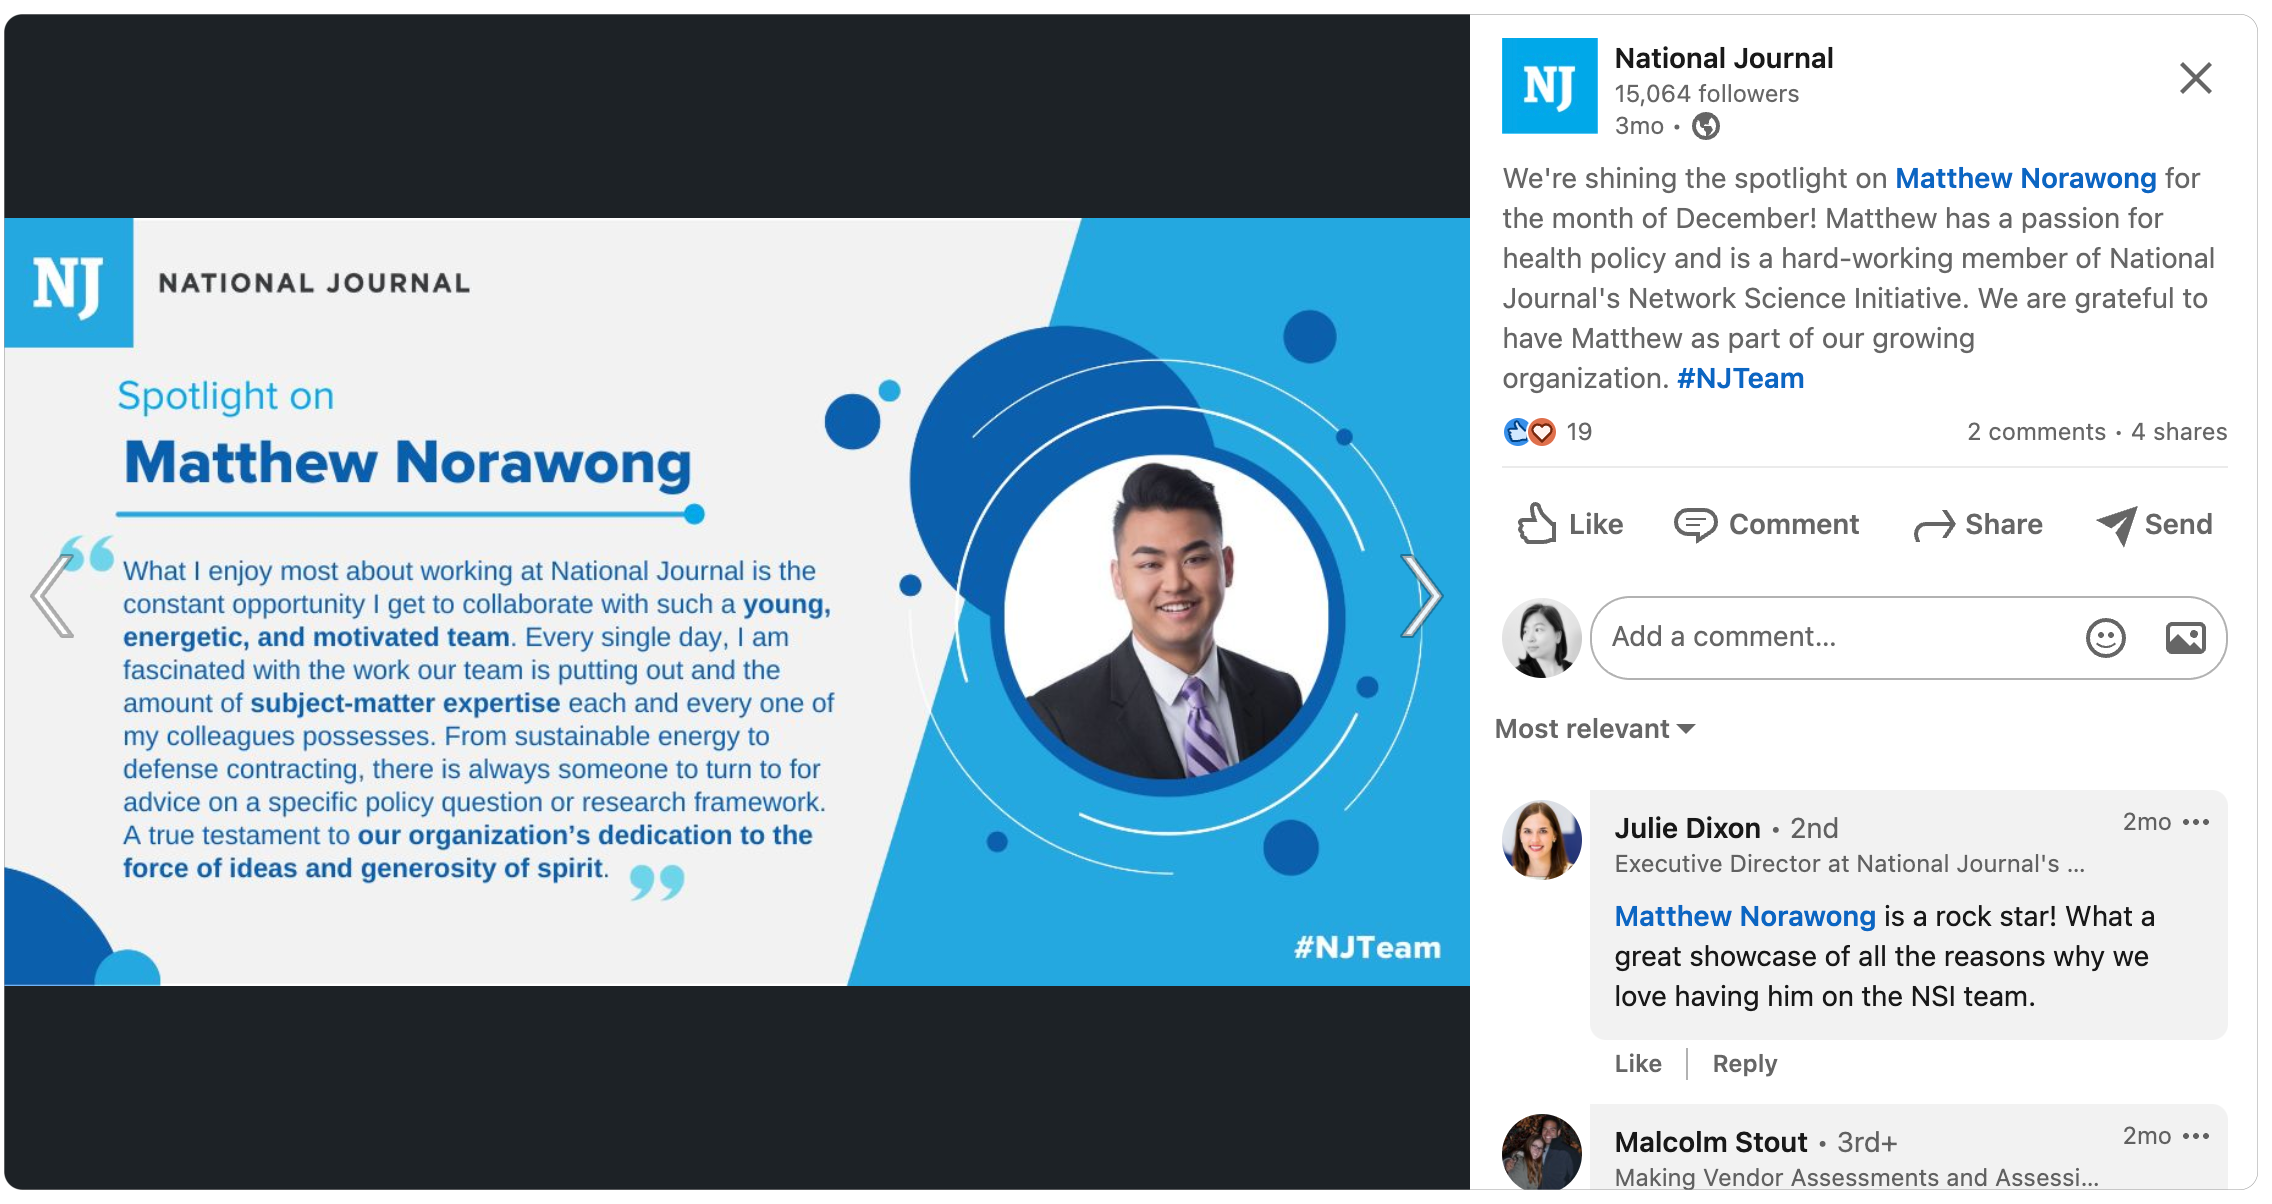
Employee Shoutouts
︎︎︎National JournalDuring Covid-19/remote work, HR and Events Team created employee shoutouts. This was a successful way to introduce coworkers, and have them share their perspectives. The shoutouts showed that National Journal is an open and humanistic company to work in.